
All Predictions
Prediction
Quote
Status
1 year ago
Moving averages will indicate market trend (sideways, uptrend, or downtrend).
And fourth, the moving average. Moving averages tell you what the market's exact strength is. Averages can tell whether the market is moving sideways, in an uptrend or a downtrend
11 months ago
Pending
Moving averages will indicate market trend (sideways, uptrend, or downtrend).
And fourth, the moving average. Moving averages tell you what the market's exact strength is. Averages can tell whether the market is moving sideways, in an uptrend or a downtrend
Pending
Pivot points will help identify market reversal points.
how it is acting. Third, comes the pivot points, which will help you identify turning points in the market, where the market might reverse.
11 months ago
Pending
Pivot points will help identify market reversal points.
how it is acting. Third, comes the pivot points, which will help you identify turning points in the market, where the market might reverse.
Pending
Screener.com provides comprehensive information on companies, including financial metrics and management details, for long-term investors conducting fundamental analysis.
screener.com. Here, those who want to invest for the long term by doing fundamental analysis or want to invest for the long term instead of trading in the stock market, they will get all the details, all the information, everything related to every company, be it RO, RE, RO, everything about the management of the company.
11 months ago
Pending
Screener.com provides comprehensive information on companies, including financial metrics and management details, for long-term investors conducting fundamental analysis.
screener.com. Here, those who want to invest for the long term by doing fundamental analysis or want to invest for the long term instead of trading in the stock market, they will get all the details, all the information, everything related to every company, be it RO, RE, RO, everything about the management of the company.
Pending
Relative Strength Index (RSI) will indicate the market's strength.
the RSI, which is the relative strength index, which tells you in simple language what the market's exact strength is.
11 months ago
Pending
Relative Strength Index (RSI) will indicate the market's strength.
the RSI, which is the relative strength index, which tells you in simple language what the market's exact strength is.
Pending
Moneycontrol.com is a source for up-to-date news on stocks and mutual funds to stay informed about the stock market.
that is money control. Here you will get the latest news related to stocks, mutual funds, everything, so that you can stay updated related to the stock market.
11 months ago
Pending
Moneycontrol.com is a source for up-to-date news on stocks and mutual funds to stay informed about the stock market.
that is money control. Here you will get the latest news related to stocks, mutual funds, everything, so that you can stay updated related to the stock market.
Pending
Fibonacci retracement tool will be useful for identifying buying opportunities during market pullbacks.
The f retracement tool is useful for this.
11 months ago
Pending
Fibonacci retracement tool will be useful for identifying buying opportunities during market pullbacks.
The f retracement tool is useful for this.
Pending
TradingView.com is a recommended platform for analyzing charts of various assets including crypto, forex, stocks, and commodities.
tradingview.com, where you can analyze the charts of everything in a better and excellent way, be it crypto, forex, stocks, commodities, anything.
11 months ago
Pending
TradingView.com is a recommended platform for analyzing charts of various assets including crypto, forex, stocks, and commodities.
tradingview.com, where you can analyze the charts of everything in a better and excellent way, be it crypto, forex, stocks, commodities, anything.
Pending
Motilal Oswal's top 20 stock picks are expected to yield substantial profits in 2025.
These 20 stocks have been suggested by Motilal Oswal himself, which means these are his top picks and it is possible that in 2025, these can make you earn crores and lakhs.
12 months ago
Pending
Motilal Oswal's top 20 stock picks are expected to yield substantial profits in 2025.
These 20 stocks have been suggested by Motilal Oswal himself, which means these are his top picks and it is possible that in 2025, these can make you earn crores and lakhs.
Pending
A minimum of 500 trades should be analyzed to determine the efficacy of a trading strategy.
take at least 500 trades before saying good or bad about a strategy
11 months ago
Pending
A minimum of 500 trades should be analyzed to determine the efficacy of a trading strategy.
take at least 500 trades before saying good or bad about a strategy
Pending
20 specific stocks are predicted to generate significant returns (crores and lakhs) in 2025.
These 20 stocks can make you earn crores in 2025.
12 months ago
Pending
20 specific stocks are predicted to generate significant returns (crores and lakhs) in 2025.
These 20 stocks can make you earn crores in 2025.
Pending
Consistent application of trading strategies can lead to significant financial gains ('lakh rupees').
and one day you will become lakh rupees
11 months ago
Pending
Consistent application of trading strategies can lead to significant financial gains ('lakh rupees').
and one day you will become lakh rupees
Pending
A strategy followed for 30 days could potentially turn 10,000 into 11,000.
and 10000 can become 11000
11 months ago
Pending
A strategy followed for 30 days could potentially turn 10,000 into 11,000.
and 10000 can become 11000
Pending
A strategy followed for 30 days could potentially turn 10,000 into 50,000.
keep doing this for the next 30 days, 10000 can become 50000
11 months ago
Pending
A strategy followed for 30 days could potentially turn 10,000 into 50,000.
keep doing this for the next 30 days, 10000 can become 50000
Pending
The speaker predicts they will significantly improve viewers' trading skills through content released in 2025 on YouTube.
I will tear you apart in trading in 2025 on YouTube.
11 months ago
Pending
The speaker predicts they will significantly improve viewers' trading skills through content released in 2025 on YouTube.
I will tear you apart in trading in 2025 on YouTube.
Pending
The speaker intends to provide trading education by 2025.
I want to teach you trading by 2025.
11 months ago
Pending
The speaker intends to provide trading education by 2025.
I want to teach you trading by 2025.
Pending
The speaker aims to enable everyone to become a trader by the year 2025.
My goal is to make everyone a trader by 2025.
11 months ago
Pending
The speaker aims to enable everyone to become a trader by the year 2025.
My goal is to make everyone a trader by 2025.
Pending
The value of a used Mango car (4-5 years old) has increased significantly, from its original price of ₹10 lakh to an offer of ₹85 lakh, due to limited supply and high demand.
When Mango came to India in 2016, you could buy a new Mango for ₹10 lakh and today I got an offer for Mango, the person told me that he is ready to pay 85 lakh to buy my Mango
1 year ago
Pending
The value of a used Mango car (4-5 years old) has increased significantly, from its original price of ₹10 lakh to an offer of ₹85 lakh, due to limited supply and high demand.
When Mango came to India in 2016, you could buy a new Mango for ₹10 lakh and today I got an offer for Mango, the person told me that he is ready to pay 85 lakh to buy my Mango
Pending
The speaker plans to teach equity trading for the next 3 months starting in 2025, implying continued guidance and progress in the market throughout that year.
Follow me for the next 3 months and I will always keep teaching you. Keep learning and will keep moving forward slowly, one step at a time in 2025.
1 year ago
Pending
The speaker plans to teach equity trading for the next 3 months starting in 2025, implying continued guidance and progress in the market throughout that year.
Follow me for the next 3 months and I will always keep teaching you. Keep learning and will keep moving forward slowly, one step at a time in 2025.
Pending
Utilizing 3-minute and 5-minute time frames for entries in intraday trading will lead to highly profitable opportunities.
you'll get amazing entries that no one can stop you from making profits worth lakhs
1 year ago
Pending
Utilizing 3-minute and 5-minute time frames for entries in intraday trading will lead to highly profitable opportunities.
you'll get amazing entries that no one can stop you from making profits worth lakhs
Pending
2 years ago
Learning trading is crucial for success; entering the market without proper education will likely lead to failure and serve as a cautionary tale.
If you learn trading, it can definitely take you to the top. But if you enter the market without learning trading, you will become an example for others as to why you should not trade.
1 year ago
Pending
Learning trading is crucial for success; entering the market without proper education will likely lead to failure and serve as a cautionary tale.
If you learn trading, it can definitely take you to the top. But if you enter the market without learning trading, you will become an example for others as to why you should not trade.
Pending
After significant trading losses, a six-month period dedicated solely to learning is recommended before returning to the market.
I lost two to four lakhs. Then I took six months. What did I do for six months? I just focused on learning.
1 year ago
Pending
After significant trading losses, a six-month period dedicated solely to learning is recommended before returning to the market.
I lost two to four lakhs. Then I took six months. What did I do for six months? I just focused on learning.
Pending
It is predicted that trading capital will eventually become zero, regardless of skill or psychological preparation.
Your capital will become zero at some point or the other, no matter how much you work on psychology, how much you learn trading.
1 year ago
Pending
It is predicted that trading capital will eventually become zero, regardless of skill or psychological preparation.
Your capital will become zero at some point or the other, no matter how much you work on psychology, how much you learn trading.
Pending
Trading income is unpredictable and inconsistent; an active income source is necessary to support oneself if trading fails in the initial months.
Trading may give you a lot of money this month, but it might take money away instead of giving you money next month. And there could be zero profit or zero loss in the third month. Therefore, you should have an active income so that if trading doesn't work for me in the first month, or in the second month, or in the third month, I still have income that can support my livelihood.
1 year ago
Pending
Trading income is unpredictable and inconsistent; an active income source is necessary to support oneself if trading fails in the initial months.
Trading may give you a lot of money this month, but it might take money away instead of giving you money next month. And there could be zero profit or zero loss in the third month. Therefore, you should have an active income so that if trading doesn't work for me in the first month, or in the second month, or in the third month, I still have income that can support my livelihood.
Pending
Major losses are predicted in the first year of trading, with quick profits being unsustainable.
There will be no quick profits in trading. Even if you do, by mistake you make profits in the first month, second month, third month. They should not last long. You will incur major losses in the first year.
1 year ago
Pending
Major losses are predicted in the first year of trading, with quick profits being unsustainable.
There will be no quick profits in trading. Even if you do, by mistake you make profits in the first month, second month, third month. They should not last long. You will incur major losses in the first year.
Pending
The Bullish Sandwich pattern, occurring after a downtrend, involves two candles followed by a third that opens with a gap up, signaling an upward movement.
What will happen this time? The market will keep coming down. Okay, this will be one two, as if it were three. Something small, as if a star had come again after that something else came like this okay then our The sandwich pattern will look something like this There's one, then another that will come with a gap up It will open here, it was closed here Our second candle closed above the first candle So our second candle should open from here I wanted it but it would be open from above something like way towards the bastard okay bastard It opened higher like a candlestick pattern Then after this our red candle will also open Whatever opens with a gap up will open here. It should have been because the green candle is here But it did not close but it went up and gaped up. something right here okay here Or it will open anywhere here. And it will look something like this, okay? This Is What It Looks Like OK? Got It? And from here an upward movement begins. Will go. Ok?
1 year ago
Pending
The Bullish Sandwich pattern, occurring after a downtrend, involves two candles followed by a third that opens with a gap up, signaling an upward movement.
What will happen this time? The market will keep coming down. Okay, this will be one two, as if it were three. Something small, as if a star had come again after that something else came like this okay then our The sandwich pattern will look something like this There's one, then another that will come with a gap up It will open here, it was closed here Our second candle closed above the first candle So our second candle should open from here I wanted it but it would be open from above something like way towards the bastard okay bastard It opened higher like a candlestick pattern Then after this our red candle will also open Whatever opens with a gap up will open here. It should have been because the green candle is here But it did not close but it went up and gaped up. something right here okay here Or it will open anywhere here. And it will look something like this, okay? This Is What It Looks Like OK? Got It? And from here an upward movement begins. Will go. Ok?
Pending
The Bearish Sandwich pattern, occurring after an uptrend, involves a green candle followed by a red candle with a gap down, and then another green candle that also opens with a gap down, signaling a bearish reversal.
Bearish Sandwich. Ok? This is berry sandwich. And there is a separate [ __ ] sandwich. Too much to remember to name sandwiches It's easy. Ok? Very easy to remember name Will remain. Because in this basically this is a Three candlestick pattern. Ok? This is A three candle pattern. end in this Particular pattern what happens is a first There is an up trend. already established up It is a trend. Then came a green candle. Green The candle came. Now after it closes here But it should have been open. With the butt gap down Here the second candle will be created in red. open Where should it have been? Open here Should have. But with that gap down It opened here. and then our beans The next candle created will be green which is here Pay means there is a small gap down in this also. Will remain. Ok? a gap down below it Will remain. here or here The green candle will open somewhere. end like this Say this will create a sandwich. And this will Be called a berry sandwich. Ok? This is a Gives bearish signal. Bearish sandwich. Understanding Came?
1 year ago
Pending
The Bearish Sandwich pattern, occurring after an uptrend, involves a green candle followed by a red candle with a gap down, and then another green candle that also opens with a gap down, signaling a bearish reversal.
Bearish Sandwich. Ok? This is berry sandwich. And there is a separate [ __ ] sandwich. Too much to remember to name sandwiches It's easy. Ok? Very easy to remember name Will remain. Because in this basically this is a Three candlestick pattern. Ok? This is A three candle pattern. end in this Particular pattern what happens is a first There is an up trend. already established up It is a trend. Then came a green candle. Green The candle came. Now after it closes here But it should have been open. With the butt gap down Here the second candle will be created in red. open Where should it have been? Open here Should have. But with that gap down It opened here. and then our beans The next candle created will be green which is here Pay means there is a small gap down in this also. Will remain. Ok? a gap down below it Will remain. here or here The green candle will open somewhere. end like this Say this will create a sandwich. And this will Be called a berry sandwich. Ok? This is a Gives bearish signal. Bearish sandwich. Understanding Came?
Pending
The Matching High pattern occurs during an upward movement, where two green candles' highs align, indicating a continuation of the upward trend.
The matching high is also the same. In matching high What will happen? This time our candles are these Instead of being red, what is it this time? Will it remain? A Green Upward Movement from Let's Is. Ok? There is a green upward movement. Then after the green upward movement, the green itself The candle will remain. Ok? The first is also green Will remain. Because we like the trend Whatever stays in me will remain green. then after that Which one of its remains open?
1 year ago
Pending
The Matching High pattern occurs during an upward movement, where two green candles' highs align, indicating a continuation of the upward trend.
The matching high is also the same. In matching high What will happen? This time our candles are these Instead of being red, what is it this time? Will it remain? A Green Upward Movement from Let's Is. Ok? There is a green upward movement. Then after the green upward movement, the green itself The candle will remain. Ok? The first is also green Will remain. Because we like the trend Whatever stays in me will remain green. then after that Which one of its remains open?
Pending
The Matching Low pattern indicates an upward movement and potential, where two candles' bottoms align.
This is what is called age matching low Pattern. This is a way for you to move upward. Gives indication. This is an upward potential Tells. Ok? did you understand or not understood? Yes or no? It was simple. got it?
1 year ago
Pending
The Matching Low pattern indicates an upward movement and potential, where two candles' bottoms align.
This is what is called age matching low Pattern. This is a way for you to move upward. Gives indication. This is an upward potential Tells. Ok? did you understand or not understood? Yes or no? It was simple. got it?
Pending
The Bearish Tri Star pattern, appearing after an uptrend with a green candle, consists of three consecutive red dojis or star-like candles, with the third being lower than the first two, indicating a downward potential or reversal.
Opposite Bearish You Know Bearish Try Star Which we will call Bearish Triple Star In which there is an already established up trend Will remain. Ok? UT will remain. Got it? Up Trend. Then a green candle followed. which will remain large with large volumes Will remain with the movement. Then after that our Three us red basically red or one hand There may be green in the middle. I told you One of the three could be Green and if If there are three greens, one of them could be red. Is. Ok? So three red doozies in this one. I will meet One Two somewhere around there. We will get it. Ok? two and three which is We'll get a little bit with a big downward. Meaning comparatively it is from both. Ok? Here are our two red doozies. It will come a little below that.
1 year ago
Pending
The Bearish Tri Star pattern, appearing after an uptrend with a green candle, consists of three consecutive red dojis or star-like candles, with the third being lower than the first two, indicating a downward potential or reversal.
Opposite Bearish You Know Bearish Try Star Which we will call Bearish Triple Star In which there is an already established up trend Will remain. Ok? UT will remain. Got it? Up Trend. Then a green candle followed. which will remain large with large volumes Will remain with the movement. Then after that our Three us red basically red or one hand There may be green in the middle. I told you One of the three could be Green and if If there are three greens, one of them could be red. Is. Ok? So three red doozies in this one. I will meet One Two somewhere around there. We will get it. Ok? two and three which is We'll get a little bit with a big downward. Meaning comparatively it is from both. Ok? Here are our two red doozies. It will come a little below that.
Pending
The Bullish Tri Star pattern, appearing after a downtrend with a red candle, consists of three consecutive dojis or star-like candles, with the third being higher than the first two, indicating an upward movement is starting.
A downtrend will occur. first a DT will already be established. then his There will be a red candle later. such as our It is in a down trend. Ok? Down A red candle entered the trend. then after that Three consecutive dojis or three star types Our candles will be created. Ok? Three consecutive greens, that too probably Mostly Green. Yes, one hand is red allowed but Being Mostly Green is Strong. Correct Is? Being Mostly Green is Strong. So here three green candles will open. Will there be three green stars or three green There will be doozies. The first one will be built here. Second will also be built around the same and the third It will be formed comparatively higher which is basically a The shift of movement will tell us that the market Now the movement has started to pick up.
1 year ago
Pending
The Bullish Tri Star pattern, appearing after a downtrend with a red candle, consists of three consecutive dojis or star-like candles, with the third being higher than the first two, indicating an upward movement is starting.
A downtrend will occur. first a DT will already be established. then his There will be a red candle later. such as our It is in a down trend. Ok? Down A red candle entered the trend. then after that Three consecutive dojis or three star types Our candles will be created. Ok? Three consecutive greens, that too probably Mostly Green. Yes, one hand is red allowed but Being Mostly Green is Strong. Correct Is? Being Mostly Green is Strong. So here three green candles will open. Will there be three green stars or three green There will be doozies. The first one will be built here. Second will also be built around the same and the third It will be formed comparatively higher which is basically a The shift of movement will tell us that the market Now the movement has started to pick up.
Pending
The Bullish Kicker pattern occurs after a downtrend, with a red candle followed by a green candle that opens above the previous candle's open, indicating a bullish reversal with a significant gap up.
So, that's one down from Let's. Trend. Ok? Established DT is it okay? Already an established DT After which a red candle came. Such as You know the red candle will open higher. The end will close below. Yes and no was simple We have already seen this thing many times. Meaning the price starts as if For example, from 100 it falls down to 90. Comes. Only then a raid is made. Red Meaning decline. Red means fall. Red means bad. That is what stock market means. whenever If you see red color, it means something is wrong. It has happened. Ok? This is the stock market Whenever I see your red. from lats For example, you placed a trade of $50. I placed a trade on that zero and that zero when If you look, it will appear red. Red means wrong Happen. So that's why it opens up is at the top and close what happens that is At the bottom. So now this is our open end. It is closed. Ok? It's open and close It's ours. Now after this our close Where should the next candle open after the candle Was? It should have opened here. Correct? But Our next candle will open after its open near means at the open or slightly beyond the open It will open above. Got it? Ok? so big It will create a gap. And this is [ __ ], Caker.
1 year ago
Pending
The Bullish Kicker pattern occurs after a downtrend, with a red candle followed by a green candle that opens above the previous candle's open, indicating a bullish reversal with a significant gap up.
So, that's one down from Let's. Trend. Ok? Established DT is it okay? Already an established DT After which a red candle came. Such as You know the red candle will open higher. The end will close below. Yes and no was simple We have already seen this thing many times. Meaning the price starts as if For example, from 100 it falls down to 90. Comes. Only then a raid is made. Red Meaning decline. Red means fall. Red means bad. That is what stock market means. whenever If you see red color, it means something is wrong. It has happened. Ok? This is the stock market Whenever I see your red. from lats For example, you placed a trade of $50. I placed a trade on that zero and that zero when If you look, it will appear red. Red means wrong Happen. So that's why it opens up is at the top and close what happens that is At the bottom. So now this is our open end. It is closed. Ok? It's open and close It's ours. Now after this our close Where should the next candle open after the candle Was? It should have opened here. Correct? But Our next candle will open after its open near means at the open or slightly beyond the open It will open above. Got it? Ok? so big It will create a gap. And this is [ __ ], Caker.
Pending
The Bearish Kicker pattern occurs after an established uptrend, with a green candle followed by a red candle that opens below the previous candle's open, indicating a bearish reversal with significant volume.
Our upward will come. already established up It is a trend. Ok? Following the uptrend We have a green candle. Ok? it There is a green candle. This is its close. it Its open. Ok? Open close. Now this Open either here or here It will start. Open Pay or even Open As you can see here below. It has started here. One below the open Will the red candle start or will the red candle Will come. Both with large volumes Will come.
1 year ago
Pending
The Bearish Kicker pattern occurs after an established uptrend, with a green candle followed by a red candle that opens below the previous candle's open, indicating a bearish reversal with significant volume.
Our upward will come. already established up It is a trend. Ok? Following the uptrend We have a green candle. Ok? it There is a green candle. This is its close. it Its open. Ok? Open close. Now this Open either here or here It will start. Open Pay or even Open As you can see here below. It has started here. One below the open Will the red candle start or will the red candle Will come. Both with large volumes Will come.
Pending
The Bullish Belt Hold pattern, occurring after a downtrend, features a short red candle followed by a large green candle with a significant gap down, signaling a short-term bullish reversal.
A downward movement occurred, followed by a short The red candle will come. Ok? Let's Say Something Like this. Something like this will come up. then after That's a gap down with a big gap down A green candle will form with. Correct Is? which will be a strong movement Candle. Ok? This one with a gap down There will be a form. You can see this is a gap Down. This is our candle with a gap down. There will be a form. And This Leads to an Upward Reversal pattern. Short Term Bullish Short Term Bullish Reversals. Short Term Reversal This is the pattern in candlesticks.
1 year ago
Pending
The Bullish Belt Hold pattern, occurring after a downtrend, features a short red candle followed by a large green candle with a significant gap down, signaling a short-term bullish reversal.
A downward movement occurred, followed by a short The red candle will come. Ok? Let's Say Something Like this. Something like this will come up. then after That's a gap down with a big gap down A green candle will form with. Correct Is? which will be a strong movement Candle. Ok? This one with a gap down There will be a form. You can see this is a gap Down. This is our candle with a gap down. There will be a form. And This Leads to an Upward Reversal pattern. Short Term Bullish Short Term Bullish Reversals. Short Term Reversal This is the pattern in candlesticks.
Pending
The Three White Soldiers pattern consists of three consecutive, similar-looking green candles that appear after an established downtrend, signaling a potential upward reversal with strong momentum and volume.
After which the market After coming down, what happened here We got three continuous green candles With a movement, with momentum, With volume. Ok? these are now what Are called as three white soldiers. This which There are, these are three white soldiers. One After a continuous down trend, a down After the trend came a DT that is down Trend. After which suddenly three similar Looking, you have to keep this thing in mind. End Three White Soldiers Who Are Similar Looking Should be.
1 year ago
Pending
The Three White Soldiers pattern consists of three consecutive, similar-looking green candles that appear after an established downtrend, signaling a potential upward reversal with strong momentum and volume.
After which the market After coming down, what happened here We got three continuous green candles With a movement, with momentum, With volume. Ok? these are now what Are called as three white soldiers. This which There are, these are three white soldiers. One After a continuous down trend, a down After the trend came a DT that is down Trend. After which suddenly three similar Looking, you have to keep this thing in mind. End Three White Soldiers Who Are Similar Looking Should be.
Pending
The Tweezer Bottom pattern occurs after a downtrend, with a red candle followed by a green candle that opens at the same level as the previous candle's bottom, indicating a strong upward movement.
One There is a particular established down trend. You might be noticing a downward trend. Established. Established Down Trend followed by a red candle which is a large Downward movement occurs. So, from here it The market came. Then a red candle here. It started. Go down here and close it. Hui. And exactly after that where It's closed, there's a green candle right there. creates a larger movement Comes up with it. this is called a tweezer Bottom pattern. Ok? Exactly you see You can see the bottom is exactly the same. Ok?
1 year ago
Pending
The Tweezer Bottom pattern occurs after a downtrend, with a red candle followed by a green candle that opens at the same level as the previous candle's bottom, indicating a strong upward movement.
One There is a particular established down trend. You might be noticing a downward trend. Established. Established Down Trend followed by a red candle which is a large Downward movement occurs. So, from here it The market came. Then a red candle here. It started. Go down here and close it. Hui. And exactly after that where It's closed, there's a green candle right there. creates a larger movement Comes up with it. this is called a tweezer Bottom pattern. Ok? Exactly you see You can see the bottom is exactly the same. Ok?
Pending
The Bullish Harami pattern, characterized by a red candle followed by a smaller green candle with a gap up, signals a potential trend reversal after a downtrend.
Established down trend is DT. What will happen after that? Let a Green Candle There will be a red candle. Ok? This Is a Raid Candle. End with a gap up after it You will see a green candle. which will B. Comparatively smaller. Ok? and after That there will be a reversal. Reversal of There are chances. And from here you will get a There is an opportunity for trend reversal.
1 year ago
Pending
The Bullish Harami pattern, characterized by a red candle followed by a smaller green candle with a gap up, signals a potential trend reversal after a downtrend.
Established down trend is DT. What will happen after that? Let a Green Candle There will be a red candle. Ok? This Is a Raid Candle. End with a gap up after it You will see a green candle. which will B. Comparatively smaller. Ok? and after That there will be a reversal. Reversal of There are chances. And from here you will get a There is an opportunity for trend reversal.
Pending
The Morning Doji Star pattern is similar to the Morning Star but features a doji candle in the middle, indicating indecisiveness and a potential upward reversal after a downtrend.
The middle one in the Morning Doji Star The candle will remain, right now I will give you the middle one It's just a candle, it will change. This is a doozie. The candle will be made. Ok? It is basically the Same thing. Only the shadows will become bigger in this. Ok? The shadow will become bigger. And The candle will become a Doji candle like this. Doji means indecisive candle. Doji candle What does it mean? Indiscriminate candle. Meaning he did not tell. We don't tell him It can be that there is upward pressure or There is downward pressure. Indusive means Onshore. Unshored means not to be known. Ok? So a Doji candle is basically the same thing. That here you have any one pressure saw. Then he took a slight pause. Is. He has neither given upward movement nor Downward movement is given. Ok? neither Downward movement is given. Not even upward Has given. Did not even give downward movement Is. That is what an indecisive candle is.
1 year ago
Pending
The Morning Doji Star pattern is similar to the Morning Star but features a doji candle in the middle, indicating indecisiveness and a potential upward reversal after a downtrend.
The middle one in the Morning Doji Star The candle will remain, right now I will give you the middle one It's just a candle, it will change. This is a doozie. The candle will be made. Ok? It is basically the Same thing. Only the shadows will become bigger in this. Ok? The shadow will become bigger. And The candle will become a Doji candle like this. Doji means indecisive candle. Doji candle What does it mean? Indiscriminate candle. Meaning he did not tell. We don't tell him It can be that there is upward pressure or There is downward pressure. Indusive means Onshore. Unshored means not to be known. Ok? So a Doji candle is basically the same thing. That here you have any one pressure saw. Then he took a slight pause. Is. He has neither given upward movement nor Downward movement is given. Ok? neither Downward movement is given. Not even upward Has given. Did not even give downward movement Is. That is what an indecisive candle is.
Pending
The Morning Star pattern, appearing after a downtrend with a red candle followed by a pause and then a morning star, signals an upward reversal.
Morning Star Pattern Downward trend, red candle. Ok? This Consider it red. Red candle then a candle Will come along. Ok? Let's Say Something Like this. And there will be a morning after that. Correct Is? There will be a slight pause after one fall and It will be morning. That Is What Morning Star Pattern Is.
1 year ago
Pending
The Morning Star pattern, appearing after a downtrend with a red candle followed by a pause and then a morning star, signals an upward reversal.
Morning Star Pattern Downward trend, red candle. Ok? This Consider it red. Red candle then a candle Will come along. Ok? Let's Say Something Like this. And there will be a morning after that. Correct Is? There will be a slight pause after one fall and It will be morning. That Is What Morning Star Pattern Is.
Pending
The inverted hammer pattern, occurring after a downtrend, indicates a potential upward reversal.
A downtrend will occur. Inverted hammer also The beans can be green or red. Is. and then an upward movement or Then we will get that information about the upward reversal. Gives indication. Ok? Same this too is for reversal.
1 year ago
Pending
The inverted hammer pattern, occurring after a downtrend, indicates a potential upward reversal.
A downtrend will occur. Inverted hammer also The beans can be green or red. Is. and then an upward movement or Then we will get that information about the upward reversal. Gives indication. Ok? Same this too is for reversal.
Pending
The Dragonfly Doji pattern, appearing after a downtrend, signals a potential upward continuation or reversal.
A down trend here Came. There was an established down trend followed by There is a chance we get a Dragon Fly Doji I get that from here an upward Continuation may come. means upward A reversal may occur.
1 year ago
Pending
The Dragonfly Doji pattern, appearing after a downtrend, signals a potential upward continuation or reversal.
A down trend here Came. There was an established down trend followed by There is a chance we get a Dragon Fly Doji I get that from here an upward Continuation may come. means upward A reversal may occur.
Pending
The bullish engulfing pattern occurs after a downtrend, where a red candle is followed by a larger green candle that completely covers the red one, indicating a chance of an upward move.
So a down trend will occur. There will be a red candle in it. Always Red The candle will remain in downtrend. Correct Is? one such as there are some candles and After that the last candle is something like this followed by a green candle It covered it completely. Ok? In this way it completely Covered the red candle. You see here There is a chance of an upward move. This is a bullish engulfing pattern.
1 year ago
Pending
The bullish engulfing pattern occurs after a downtrend, where a red candle is followed by a larger green candle that completely covers the red one, indicating a chance of an upward move.
So a down trend will occur. There will be a red candle in it. Always Red The candle will remain in downtrend. Correct Is? one such as there are some candles and After that the last candle is something like this followed by a green candle It covered it completely. Ok? In this way it completely Covered the red candle. You see here There is a chance of an upward move. This is a bullish engulfing pattern.
Pending
A hammer pattern occurs after a downtrend and signals a potential upward reversal, indicating that the chances of the price going up are present.
A hammer will occur after a downtrend. Hammer-like, basically a one-handed hammer type Will come. And what is gonna happen is hammer From here you will expect a reversal in the pattern. Possibility will be found. From here he is a It is giving indication that the chances of going up Are.
1 year ago
Pending
A hammer pattern occurs after a downtrend and signals a potential upward reversal, indicating that the chances of the price going up are present.
A hammer will occur after a downtrend. Hammer-like, basically a one-handed hammer type Will come. And what is gonna happen is hammer From here you will expect a reversal in the pattern. Possibility will be found. From here he is a It is giving indication that the chances of going up Are.
Pending
The three-line strike pattern is a bullish continuation pattern characterized by three green candles, indicating an established uptrend.
The three-line strike pattern is a This is a bullish continuation pattern. into what It happens? You will see three green candles. Has been. It already has a Continuous It gets updated. an already identified or Then there would be an already established up trend Is.
1 year ago
Pending
The three-line strike pattern is a bullish continuation pattern characterized by three green candles, indicating an established uptrend.
The three-line strike pattern is a This is a bullish continuation pattern. into what It happens? You will see three green candles. Has been. It already has a Continuous It gets updated. an already identified or Then there would be an already established up trend Is.
Pending
Avoid forex trading for 10-15 days leading up to the new year. Start proper trading again after the first five days of the new year (2025).
avoid this for 10-15 days now, as soon as the new year starts, wait for five days and then start proper trading comfortably, it will be good, make 2025 your year
1 year ago
Pending
Avoid forex trading for 10-15 days leading up to the new year. Start proper trading again after the first five days of the new year (2025).
avoid this for 10-15 days now, as soon as the new year starts, wait for five days and then start proper trading comfortably, it will be good, make 2025 your year
Pending
Bitcoin is predicted to reach $100,000 by the end of 2025.
I wouldn't be surprised if we saw Bitcoin reach $100,000 by the end of 2025.
1 year ago
Pending
Bitcoin is predicted to reach $100,000 by the end of 2025.
I wouldn't be surprised if we saw Bitcoin reach $100,000 by the end of 2025.
Pending
AI drug discovery is predicted to become a major industry.
I think that AI drug discovery is gonna be huge.
1 year ago
Pending
AI drug discovery is predicted to become a major industry.
I think that AI drug discovery is gonna be huge.
Pending
Bitcoin is predicted to surpass its all-time high by the end of 2025.
I do believe that Bitcoin is going to surpass its all-time high within the next 12 months. So, by the end of next year, 2025, I think we're going to see new all-time highs in Bitcoin.
1 year ago
Pending
Bitcoin is predicted to surpass its all-time high by the end of 2025.
I do believe that Bitcoin is going to surpass its all-time high within the next 12 months. So, by the end of next year, 2025, I think we're going to see new all-time highs in Bitcoin.
Pending
Expect around 100 successful SPAC IPOs in the next year.
And I think we're gonna see a lot more SPACs actually go public and, and have some success here in the next year, you know, maybe another 100 or so.
1 year ago
Pending
Expect around 100 successful SPAC IPOs in the next year.
And I think we're gonna see a lot more SPACs actually go public and, and have some success here in the next year, you know, maybe another 100 or so.
Pending
Intraday traders can achieve an annual return of 30-40%.
Overall, it can be withdrawn at 30 to 40 percent annually.
1 year ago
Pending
Intraday traders can achieve an annual return of 30-40%.
Overall, it can be withdrawn at 30 to 40 percent annually.
Pending
Well-selected stocks can yield an annual return of 20-25%.
then it has been seen that it can be withdrawn at 20 to 25 percent
1 year ago
Pending
Well-selected stocks can yield an annual return of 20-25%.
then it has been seen that it can be withdrawn at 20 to 25 percent
Pending
The speaker expresses trust in the Indian market, specifically the Nifty index, as a potentially safer investment option compared to individual stocks.
I trust my country, I trust Nifty.
1 year ago
Pending
The speaker expresses trust in the Indian market, specifically the Nifty index, as a potentially safer investment option compared to individual stocks.
I trust my country, I trust Nifty.
Pending
There is a high probability of becoming profitable in trading after watching a 3-hour video.
After watching the 3 hour video, there are many chances of becoming profitable in trading.
1 year ago
Pending
There is a high probability of becoming profitable in trading after watching a 3-hour video.
After watching the 3 hour video, there are many chances of becoming profitable in trading.
Pending
Mutual funds are expected to yield an annual return of 10-15%.
in this you can expect an annual return of 10 to 15 percent.
1 year ago
Pending
Mutual funds are expected to yield an annual return of 10-15%.
in this you can expect an annual return of 10 to 15 percent.
Pending
An additional 10 lakhs is projected to be made from a starting point of 0 in the following days.
Next day, and definitely, we will make ₹10 lakh from 0000.
1 year ago
Pending
An additional 10 lakhs is projected to be made from a starting point of 0 in the following days.
Next day, and definitely, we will make ₹10 lakh from 0000.
Pending
The capital is predicted to double, with a stop loss set at ₹2,000,000.
Here I will keep a stop loss of ₹2000000, which means the capital will double.
1 year ago
Pending
The capital is predicted to double, with a stop loss set at ₹2,000,000.
Here I will keep a stop loss of ₹2000000, which means the capital will double.
Pending
A target of making 50 lakhs from a capital of 10 lakhs is expected to be completed within a few months with proper risk management.
If we follow the right risk management in the right way, then within a few months this entire target will be completed.
1 year ago
Pending
A target of making 50 lakhs from a capital of 10 lakhs is expected to be completed within a few months with proper risk management.
If we follow the right risk management in the right way, then within a few months this entire target will be completed.
Pending
A strong support area is predicted at ₹50,000,000.
there can be a possible strong support area at ₹5000000.
1 year ago
Pending
A strong support area is predicted at ₹50,000,000.
there can be a possible strong support area at ₹5000000.
Pending
Gold price is predicted to reach ₹1 lakh within the next two to three years, assuming current growth trends continue.
if the growth continues like this, then within the next two to three years, the rate of gold should go up to ₹1 lakh instead of 82000.
1 year ago
Pending
Gold price is predicted to reach ₹1 lakh within the next two to three years, assuming current growth trends continue.
if the growth continues like this, then within the next two to three years, the rate of gold should go up to ₹1 lakh instead of 82000.
Pending
The speaker predicts a share price will reach 2110 and plans to sell 3000 out of 10000 shares at 2130, realizing a profit of 30000 on that portion.
I think that it may go even higher after 2110. So when it goes to 210, what can I do? Out of my 10000 shares, let's say, I will sell 3000 shares at 30.
1 year ago
Pending
The speaker predicts a share price will reach 2110 and plans to sell 3000 out of 10000 shares at 2130, realizing a profit of 30000 on that portion.
I think that it may go even higher after 2110. So when it goes to 210, what can I do? Out of my 10000 shares, let's say, I will sell 3000 shares at 30.
Pending
Identified a potential strong support area at ₹5,000,000.
there can be a possible strong support area at ₹5000000.
1 year ago
Pending
Identified a potential strong support area at ₹5,000,000.
there can be a possible strong support area at ₹5000000.
Pending
ADFC shares purchased in 2005 are worth a significant amount ('lakhs') today.
these ADFC shares of 2005 which are worth lakhs today
1 year ago
Pending
ADFC shares purchased in 2005 are worth a significant amount ('lakhs') today.
these ADFC shares of 2005 which are worth lakhs today
Pending
ADFC shares purchased in 2005 are worth a significant amount ('lakhs') today.
these ADFC shares of 2005 which are worth lakhs today lakhs
1 year ago
Pending
ADFC shares purchased in 2005 are worth a significant amount ('lakhs') today.
these ADFC shares of 2005 which are worth lakhs today lakhs
Pending
Traders should not rely solely on support and resistance; additional confirmations like chart or candlestick patterns are necessary for making trading decisions.
you should not trade only on the basis of support and resistance, you have to look for one or two other confirmations there, like for example, you found a good pattern there, a chart pattern, a candlestick pattern
1 year ago
Pending
Traders should not rely solely on support and resistance; additional confirmations like chart or candlestick patterns are necessary for making trading decisions.
you should not trade only on the basis of support and resistance, you have to look for one or two other confirmations there, like for example, you found a good pattern there, a chart pattern, a candlestick pattern
Pending
A breakout occurs when the price does not reverse at a resistance level but instead moves beyond it.
it did not, it did not reversal, it did not break through the resistance, which was our ₹100, this is called a breakout.
1 year ago
Pending
A breakout occurs when the price does not reverse at a resistance level but instead moves beyond it.
it did not, it did not reversal, it did not break through the resistance, which was our ₹100, this is called a breakout.
Pending
Price reversals at support or resistance levels are not guaranteed; the price may break through these levels.
if the market reaches support, it is not necessary that the price will reverse from here. I mean, if the price was at 80 here, it was repeatedly hitting 80 and going up, it does not necessarily mean that it will remain at 80 all the time. It will break it sometime. It will definitely go to 70 sometime. Similarly, if it was at 100 on the upside, it will definitely go to 110 sometime. So, reversals are not guaranteed.
1 year ago
Pending
Price reversals at support or resistance levels are not guaranteed; the price may break through these levels.
if the market reaches support, it is not necessary that the price will reverse from here. I mean, if the price was at 80 here, it was repeatedly hitting 80 and going up, it does not necessarily mean that it will remain at 80 all the time. It will break it sometime. It will definitely go to 70 sometime. Similarly, if it was at 100 on the upside, it will definitely go to 110 sometime. So, reversals are not guaranteed.
Pending
Trading directly at exact support/resistance points carries risk (approximation risk); using zones instead helps avoid missing trades or making mistakes.
there is an approximation risk, if you go from the exact point then there will be a risk, similarly if you create a zone that if it comes anywhere between this zone and here then I can buy, then you will not miss out on anything and you will not make any mistake
1 year ago
Pending
Trading directly at exact support/resistance points carries risk (approximation risk); using zones instead helps avoid missing trades or making mistakes.
there is an approximation risk, if you go from the exact point then there will be a risk, similarly if you create a zone that if it comes anywhere between this zone and here then I can buy, then you will not miss out on anything and you will not make any mistake
Pending
Support and resistance levels should be drawn as zones rather than single lines to account for minor price variations and provide better trading results.
Support and resistance levels are always drawn in zones, never a single line is drawn for better and let's give you best results, because what happens is that sometimes there will be a difference of a few points because nothing is perfect, my brother
1 year ago
Pending
Support and resistance levels should be drawn as zones rather than single lines to account for minor price variations and provide better trading results.
Support and resistance levels are always drawn in zones, never a single line is drawn for better and let's give you best results, because what happens is that sometimes there will be a difference of a few points because nothing is perfect, my brother
Pending
Speaker expresses confidence that Nifty and Bank Nifty will rise further, predicting good profits in 5-10 years.
I have confidence in the Indian economy that Nifty will rise further, Bank, Nifty will rise further, and I might make a good profit in five or ten years, when they are at an all-time high.
1 year ago
Pending
Speaker expresses confidence that Nifty and Bank Nifty will rise further, predicting good profits in 5-10 years.
I have confidence in the Indian economy that Nifty will rise further, Bank, Nifty will rise further, and I might make a good profit in five or ten years, when they are at an all-time high.
Pending
Speaker expresses confidence in the Indian economy, predicting further rises in Nifty and Bank Nifty, expecting good profits within 5-10 years.
I have confidence in the Indian economy that Nifty will rise further, Bank, Nifty will rise further, and I might make a good profit in five or ten years, when they are at an all-time high.
1 year ago
Pending
Speaker expresses confidence in the Indian economy, predicting further rises in Nifty and Bank Nifty, expecting good profits within 5-10 years.
I have confidence in the Indian economy that Nifty will rise further, Bank, Nifty will rise further, and I might make a good profit in five or ten years, when they are at an all-time high.
Pending
Traders should not rely solely on support and resistance for trading decisions; additional confirmations are necessary.
you should not trade only on the basis of support and resistance, you have to look for one or two other confirmations there
1 year ago
Pending
Traders should not rely solely on support and resistance for trading decisions; additional confirmations are necessary.
you should not trade only on the basis of support and resistance, you have to look for one or two other confirmations there
Pending
Predictions that support will always lead to an upward move and resistance will always lead to a downward move are incorrect, as breakouts can occur.
if it reaches support, it will definitely go up, or if it reaches resistance, it will definitely fall, it can happen. Break it down as well.
1 year ago
Pending
Predictions that support will always lead to an upward move and resistance will always lead to a downward move are incorrect, as breakouts can occur.
if it reaches support, it will definitely go up, or if it reaches resistance, it will definitely fall, it can happen. Break it down as well.
Pending
A resistance level will eventually be broken, leading the price higher.
if it was at 100 on the upside, it will definitely go to 110 sometime.
1 year ago
Pending
A resistance level will eventually be broken, leading the price higher.
if it was at 100 on the upside, it will definitely go to 110 sometime.
Pending
A support level will eventually be broken, leading the price lower.
It will break it sometime. It will definitely go to 70 sometime.
1 year ago
Pending
A support level will eventually be broken, leading the price lower.
It will break it sometime. It will definitely go to 70 sometime.
Pending
Support levels do not guarantee a price reversal.
if the market reaches support, it is not necessary that the price will reverse from here.
1 year ago
Pending
Support levels do not guarantee a price reversal.
if the market reaches support, it is not necessary that the price will reverse from here.
Pending
Smart money refers to large institutional investors or entities with significant capital who can influence market movements. Their actions, such as aggressive buying or selling, or trading based on inside information, can create price gaps and market manipulations like fake breakouts.
I learned something called breakout, if here okay if he takes support from here Tests this level Tests this level Testing means we test it retest says ok test again He now resists what he had before tries to build support okay Previous tries to build support Resistance, okay, that was resistance now. He will come down and test this level if If she gives support then this is a new support. It will be okay if he doesn't support it. So it's back to showing a fake breakout and it's just A false breakout will occur and the market will also He is still in trend, understand me. whether I understand it or not, it's okay I'm going to explain it again one more time. Correct It's like this resistance level is support. This is the level, the market was moving up and down. Up and down, up and down, gave a break out After the breakout, the market comes back down. It felt okay, it started coming back down now. When we started coming down, our first This was resistance, now it can become our support. It can become correct if it is supported If it goes up with support then it becomes support It will be fine and if it gives fake breakout If it comes back down then it is not support This support will be cancelled and now Our resistance will remain alive and if It takes support if it takes support If he takes it, it's a very good entry. For a trade it is called Retest Trading The strategy is fine, although the breakout end Retest will say because first breakout Breakout happens when it is not direct It comes down and becomes a support if this It takes even a little support to go up There is no need for even a little bit as soon as here Took support, we saw a couple of green candles After that we immediately took entry and it was great. You can book profit in the same way On the contrary, if the market moves in the downward direction Wait a second, first you guys take note of those People did not note it, note it immediately I would also explain with the example below. Okay, I noted it down, done, I'll move on. I'm growing up, if the same thing were happening the other way around Okay, reverse edge in market if support It used to brake as if it was the market He broke the support, he broke the support What happens after he breaks up? There are many possibilities, it could be that Dakkad Direct Break Out From Here He may test this level again which We supported him in creating resistance. Try it, but now that attempt fails. If it happens then we will not call it a breakout. We will consider it a false breakout or fake. Consider a breakout if this attempt fails It happens but if he tests this level takes resistance, meaning bumping it down It goes as if it had previously given a down breakout Then give a breakout and find the meaning of resistance went to the old support which was new Resistance can be formed if it Gave resistance and hit the chart from there If it goes down even a little bit, we are in for down. Can take trade Open trade for down can do this is called breakout end Retest Trading Strategy Just Give Me One minute I charge it and start the video again turn on
1 year ago
Pending
Smart money refers to large institutional investors or entities with significant capital who can influence market movements. Their actions, such as aggressive buying or selling, or trading based on inside information, can create price gaps and market manipulations like fake breakouts.
I learned something called breakout, if here okay if he takes support from here Tests this level Tests this level Testing means we test it retest says ok test again He now resists what he had before tries to build support okay Previous tries to build support Resistance, okay, that was resistance now. He will come down and test this level if If she gives support then this is a new support. It will be okay if he doesn't support it. So it's back to showing a fake breakout and it's just A false breakout will occur and the market will also He is still in trend, understand me. whether I understand it or not, it's okay I'm going to explain it again one more time. Correct It's like this resistance level is support. This is the level, the market was moving up and down. Up and down, up and down, gave a break out After the breakout, the market comes back down. It felt okay, it started coming back down now. When we started coming down, our first This was resistance, now it can become our support. It can become correct if it is supported If it goes up with support then it becomes support It will be fine and if it gives fake breakout If it comes back down then it is not support This support will be cancelled and now Our resistance will remain alive and if It takes support if it takes support If he takes it, it's a very good entry. For a trade it is called Retest Trading The strategy is fine, although the breakout end Retest will say because first breakout Breakout happens when it is not direct It comes down and becomes a support if this It takes even a little support to go up There is no need for even a little bit as soon as here Took support, we saw a couple of green candles After that we immediately took entry and it was great. You can book profit in the same way On the contrary, if the market moves in the downward direction Wait a second, first you guys take note of those People did not note it, note it immediately I would also explain with the example below. Okay, I noted it down, done, I'll move on. I'm growing up, if the same thing were happening the other way around Okay, reverse edge in market if support It used to brake as if it was the market He broke the support, he broke the support What happens after he breaks up? There are many possibilities, it could be that Dakkad Direct Break Out From Here He may test this level again which We supported him in creating resistance. Try it, but now that attempt fails. If it happens then we will not call it a breakout. We will consider it a false breakout or fake. Consider a breakout if this attempt fails It happens but if he tests this level takes resistance, meaning bumping it down It goes as if it had previously given a down breakout Then give a breakout and find the meaning of resistance went to the old support which was new Resistance can be formed if it Gave resistance and hit the chart from there If it goes down even a little bit, we are in for down. Can take trade Open trade for down can do this is called breakout end Retest Trading Strategy Just Give Me One minute I charge it and start the video again turn on
Pending
A retest occurs when a market, after a breakout or breakdown, returns to the previous support or resistance level that was just breached. If this level then acts as expected (e.g., former resistance becomes support and holds), it presents a trading opportunity. If the retest fails and the price reverses, it indicates a false breakout.
Now let me give you question number three. Giving people the answer to question number three Yes, you guys should come immediately. Hope you drew it, wait, I'm about to draw it. I'm giving you guys two minutes Make all the notes of those who I did not make notes right away. Make it okay now I will erase I hope everyone took notes. You must have made it, okay, hope full everyone. became notes of Okay, now I will ask question number three. I am giving you the answer, you give it to me Is This is question number three, let me ask a I will talk directly with the price. is ₹ and as the market went up it came down went down came up went down came up came down went up went down came up went down okay this is it one This is done with a This is Let's ₹10 out of this What is support Having more What is the resistance between 120 and 60? What is support and what is resistance? Three, okay, otherwise I will answer it. I won't give it to you, just comments. I want to answer you guys, support What is it and what is resistance to you? I have to answer right now, okay now we We will come to an important point about this. Support and Resistance SN R Cain B Angle Edge Well Angle Edge Well means what happened brother what does angle as well mean Let's explain it, let's start from 0. For our people to understand, okay, this is 0 The price is the market, it went up and down. went down went up came down went up came down 6 5 70 75 Now look, some trend is visible 80 If you look here, there is a line like this Let's add okay one second no my little If your heart is being touched then repeatedly turn on the screen What if we move and add a line like this? This is not becoming a support okay and If you look at the price difference of every 55 If it is being made on this site then it is a complete proper Our support is becoming right and so is Let's say above it is 80, 85, 90, 95 So should the support and resistance angles. It could be like this and it could be like this This is a what we learned first That is ₹ ₹10 now what happened this time 60 65 7075 This is our Support This line became our support and Similarly, what happened in the Resistance? The upper line in the resistance If it happened then I hope you would have understood. Resistance and support levels also in angle and such straight horizontal ones can also be Such straight lines can be horizontal It is said that this is called an angle, okay. It's simple, there's nothing much to it, just draw it. Make two notes, everyone, immediately. Make notes, okay, I have made notes. I am erasing Okay, I've erased everything, now we're Next we will study the next concept about SNR in SNR is Never A no just never just write we will okay Never Just a Line It is always a zone as I am writing all Things are not written like that, you have a zone and Range what would that mean that I just now Simplification ki tumko a single line It's okay, but what will happen to the market? There will never be a single line in it, meaning How about if there is support, okay? I draw and tell you more like that Simple will suit you guys. If you are looking at this then this There is so much zone from where the market repeatedly Taking support, agreeing to a number If this is a person between 80 and 82 years old then What are the support and resistance levels? Nor are they always made in public, ever. Not a single line is drawn for better And let's get the best results if you Because what happens is sometimes a little There will be a difference in points because There is no such thing as perfect, right? Brother, as we say, it seems as if you have no He asks, brother, how much will this thing cost? He says let's buy potatoes between ₹50 and ₹100. Those who are in the middle will come for the middle. It happens the same way if you look above. There's a zone like this up there as well. Because its point is different, its point is different Its point is different, its point is different Look, these two points are a little different. If it is different then there is a zone for this Support and resistance are always drawn in the zone You should use the Rectangle tool for this. You can use a lot of things for this You can use the tools I give you when If I go to the chart, I will explain it, similarly when such There will also be a chart, right? So, it is such a There will not be a single line, it will be like this usually There will be one zone, okay, this will be one person like this. Similarly, look above also, there will be such a zone In which margin of errors is your saving grace. what happens is that you don't We can say that the market is exact at this point Only if he comes will he go around here. You can also take it here, okay, I mean Whatever support you want to take, it should be at this exact point. whether it is a little above or a little below So we always create a zone. Okay, he won't take it at the exact point. Sometimes a little up a little down a little bit So there will be a margin for error, friend. If margin is there then support and resistance I am always in a zone right now, I am you You know, tell people all this by drawing. Because if I'm on the charts right now If I go, it will be much longer. This video means I don't think in 4 hours It will also be complete again, okay, let's do this. Another one of our support and resistance points is gone. Important points you need to know Then there were Examples and Depictions. I gave you both and then After I told you this horizontal It could also be this angle, it could also be this I also explained the thing A. Support and resistance areas that occur How this can also be labeled as demand and supply We can also call public support as demand public. Are and resistance We can also call it supply people. Why look like we talked about it when When demand increases, the price increases. When the market repeatedly hits 80 If it is coming then what are people doing at 80 They are saying goodbye, they know when it reaches 80 It is also coming, the market is going up He said buy here, meaning demand. created due to which the market went up So we can also call the support zone as demand zone. Similarly, when the market repeatedly moves above 120 But if it is falling down then what can people do? The sale is going on at exactly 120 We are paying tax, we are paying sales tax meaning Creating supply and supplying After we learned what the sellers increases when the number of watermelon sellers increases If you go, its price will fall. The price then falls from 80, so it increases Because there are many buyers from 120 It falls because there are too many sellers. Because of this selling point that is Resistance point buying point meaning Support point hopefully this is also clear must have gone okay how to trade with support and Resistance as a Beginner if you Trades based on support and resistance If you want to take, then see how you should take trades Support and resistance are very easy Taking trades on the basis of but I am a simple I will tip only on this basis. Not taking a trade No trade Sorry brother, it would take time to write that. Yes, but this is important, that's why I'm telling you. Only support and resistance One does not have to take trades on one basis or the other. Confirmation should be accompanied by one thing You never get your full money on the basis I want to see at least a couple of other things. Which gives you confirmation that brother, it is like this. It is going to happen like for example, we will After some time, the patterns of candle sticks candlestick patterns If you add this to it, you have Now there are two confirmations, now the first confirmation This is the second confirmation, now that both You can take the trade once you get the confirmation. Okay, this is how you can take the trade. Let's take a look at the chart Because I don't want to give up anything It will take more than a minute, is it two minutes? It will take more, okay, so now on to the chart. we come Now I am going to tell you the support and resistance levels. I show people, see if we talk. So simple let's see here where more Easy on will go a minute look if we talk here But this Look what has happened, this is question number four q4 what is this question number four this What Is tov yes this is Support Support If we wanted a level, even a single line would be enough. could have made it okay make a single line Could have looked like this, but somewhere from here I have taken support from somewhere, I have taken it from here Have you ever taken it from here anywhere? taken from here, ever taken from here There is a slight difference of points, exactly. There is a points difference, so there is always a zone. Something like this is created, a zone is created It is said that brother, somewhere in between this Support can also be taken in the same way If we look at resistance, there is an angle in it. Look carefully at the resistance Look at one such angle resistance in which Sometimes taken from here, sometimes taken from here Sometimes taken from here, sometimes taken from here I guess I didn't draw it right. Okay, there's an angle resistance, so like this. There is a support and a resistance Hitting resistance in the market It comes down again and again, it comes crashing down It comes down by hitting the support goes up, bumping, goes up, bumping goes up got it okay two minutes It took a lot but I also told you guys this I explained it, now I explained a new thing, one more thing, okay. Now let's go back to our screen. My face is back in front of you guys It must have been and now I will take a look and What are the next topics so that we Don't miss out on anything, maybe right now Start the video and it's already been one and a half hours. It is done and we are proceeding forward To the Next Points Okay, an understanding approximation. Risk is basically the same thing as approximation. I will explain it to you guys at the risk When we talk about charts, Exactly, yes exactly from this point It is not necessary to take reversal, you will think that I If the exact result comes here then I will say goodbye, see. You thought he went from here on up. I will come here and say bye, then I went downstairs I thought I would come back here and say bye downstairs. Went here and came to the exact point here and went down as if here and If it went from top to top, then one There is a risk of approximation if If you go from the exact point then there is risk. It will remain the same if you create a zone that From this zone to anywhere in between If yes, I can say bye then you will miss me. You will not let anything or anyone out of you There will be no problem, similarly here also there is a The zone will be created, okay, I have made a little more zone. made it bigger A zone will be created here as well, okay brother. Look, it happened somewhere here, somewhere here. It happened here somewhere P It happened here somewhere P If one person comes here then a zone is formed. It's okay, it should always be done in one zone. Other wise there is a risk that one trade Miss it or the trade goes wrong Okay, I'm sorry I left without you guys. I drew it and erased it, you guys draw it. immediately in Two one drawn, okay Good, I hope everyone is taking all the notes. Because this thing can take you anywhere You will not get the paid courses you want. You guys can buy this much knowledge. I am not going to give it for free, please. Understand that no one is going to give it to you. The next point price reversal is always Not guaranteed, look at support If the market comes, it is not necessary that If he reverses the price from here, that means The price of 80 was running here again and again. He was going up after hitting it at 80. Meaning it is not necessary that it will remain at 80 every time He will break it someday, he will go to 70 someday. So 70 will go upwards in the same way if If it was at 100 then someday it will reach 110. Reversals are not guaranteed, write this point down. Reversals Are not Guaranteed that if it reaches support, it will definitely go up. will rise or will it fall if it encounters resistance It will surely fall, it may even break it. As you remember a while ago I You guys break out and do something What breaking out taught me I was taught that my mother told me to go and buy potatoes. You are going to buy potatoes, right? So potatoes 50 should come between ₹ to ₹ but as if someone Due to the region its price has increased by ₹ aa If you go someday, there will be a breakout, right? The number that comes here should be reversed from 0. She should have been around 50, but she She did not come and did not give reversal. From the resistance which was our 0 He broke the resistance without taking any action. This is called a breakout. Okay, now I understand. You guys are not guaranteed a reversal. But majority of the time if you guys do it the right way Learn to study price action from You will understand when the reversal happens. When is he going to take it and give it a breakout? Learn more about breakouts. I will understand okay next a as I talked only and only support and Not taking trades based on resistance There is someone there for you, one or two more You have to see the confirmation like for example You might find a nice pattern there. gota chart pattern gota candlestick You guys got the pattern by the way and If you want more courses then I have provided complete free courses. of cost to you price action I have created a trading course and it is still being made. Then with this I have done candlestick patterns I created a trading course and then with it I I created a chart pattern trading course People created intraday pattern trading course I am selling such courses for lakhs. Sitting for so many hours just for you people I am giving these courses for free in return. I don't want anything, please like and comment. Subscribe Subscribe to the channel friend please please please please a little This is a request for your younger brother's channel A little bit of mind is that friend YouTube impacted the lives of 1 million people I have to do this, this is my goal, okay, so let's go. We have talked about these things, now let's talk We will talk about trading with breakouts. okay now we'll talk about trading with Breakouts We've covered a little bit of breakouts Got it, now let us discuss breakouts in detail. After this we will understand many things and many more. The thing we have to understand is I have lots of things For you guys and it's going to be great Don't worry about lectures, I have the energy. I still have energy, brother, by creating energy Keep the energy up, this is going to be One hell of a course such a course nahi you You will never see it nor will you ever get to see it and There will be no one left either, so just wait for me And let's move on. Next is Trading with b I'm writing it b this is Breakouts and BD that is breakdown okay It is simple, the market is when a support or breaks the resistance right when When it breaks support or resistance The market will travel further in that direction. For example, if the price of something is ₹1 was stuck when he broke 100 and reached 105 It is done only when you achieve it or achieve 110%. Now he can run even further and reach 120 km. Achieve it, okay, in the same way if you focus on something Now a bad news has come, obviously from 100 Why would he have achieved 110 when some It must have been good, right, it must have been good, good News Good But Maybe He's Breaking Out When it happens, when there is a breakout, the MA goes up even further. Let's go as if some bad news has come It's bad news, something bad has happened. Its price may break 50 downwards and reaches 40 and when the bad things come up and bad things happen so then Can't tell when she went from 40 to 30. okay so to go he's 40 It can also go up to 30, so break out and Trading on a breakdown basis is What happens is that when a breakout occurs, when a ₹1 If he has broken the level then people will believe that that now he will run higher because this This is a good sign because he has done something new. For example, if someone has achieved something Bronze achieves as if from a let One of our guys went to the Olympics. Believe that the East has gone to the Olympics. This year he scored bronze, next year he If you did silver then what will you believe now that next You believe that gold can do this, right? Psychology has come to people's minds. It goes the same way as when Purab struck bronze. So now that was 100 bronze, his bronze He achieved now he has 110 silver medals So what are people expecting now? 120 should go away friend, now Gold will kill this Same as when Purva's performance Earlier he was on gold, first year he won gold Mara in the second year, he struck silver in the third Sal struck bronze, now people believe Maybe nothing will kill me this time. Because his performance is gradually deteriorating. If it's happening, it's getting worse when it falls when he breaks 50 And if you achieve 40, people believe even more. can go down so that and cell cell cell and when it breaks out, it Bye bye and like I said I explained to you what happens when I say goodbye. If the demand increases, then the demand increases What happens if the price increases, simply People buy because when there is a breakout of expectation then after buying Demand increases and as demand increases Price increases as soon as it breaks down It happens, BD happens, sorry, BD happens breakdown then what do people do they sell Because of their expectation that brother now So it's going to break because it's coming down so low. Gaya right when something keeps falling People think it will fall further and further. And it will fall like Purab Gold hit Silver I hit bronze, this time I didn't get dull anymore. People think that now the East has gone. When the East went, people would think that Sellers grow when they sell and sell When the watermelon sellers had increased What happened, the price fell further? If the price starts falling further, then trading with Breakouts and breakdowns this way Works when breakouts occur People say bye and because of that and above When there's a breakdown, people sell Because of this the market goes down further. Okay, let's read it in more detail now. can definitely definitely read Yes, but I am thinking in this video If we read into more detail, You are too difficult for people I will go but I will still get my work done. You guys go to the chart once and that's it teaching things okay now look what's here It's simple, let's assume we can draw. taking Wait a minute, yes, see what the support level was. Look at the support level once, we support you. Level Dr will do something about it Right around here was our support level. Correct, this became our resistance. level this has become our resistance level okay The one below is done Support is done Resistance: Now look at the market which is stuck. had happened Around 1600 16670 K Around 1600 to 1670, he He was stuck now when he broke 1670 Look here in 1680 when he achieved One second after he achieved 1680 Look at the huge bull run the market has taken This is the market, first look at it, like this, like this, like this He was moving like this everywhere, like this After seeing him, he ran away immediately, nothing like that. It's not like that, it's straight up, so why did this happen? Because he has given a breakout here There was a resistance here which He broke 1670 now When the price broke, it made a new high. what people believe is a good thing when If something good happens, people believe it. Bronze is here, now silver is here, now gold is here I want gold to come now, I expect it to come that way. Tension increased among the people, people said bye bye Did the demand increase? Due to increase in demand, demand increased. Wait increased, demand increased and as demand increased The price has also increased, hope you understood. Hope you guys understood, okay? Explained as breakout, same break Down works if it's on the bottom If I had broken it, I would have run downwards, okay? Hope you have understood how to trade on this basis. If I explain how to do all these things If you want, there will be a dedicated full form on that too. I will bring it, okay, let's go to the next one. our okay my screen over topic My face is back in front of you all. There will be hope fully, after this there is understanding. Look, we have a lot of candlesticks now. We understood things, we looked at the charts. I've seen so many different charts now. It's time to look at the candlesticks because Look what's in the end inside the charts no what is this what is this all this Everything is a candlestick, so first the candle Sticks are better than candles If we talk about sticks, look at this candle. There's a concept in a stick OAC: It is important to understand this first. Means Open h means High L Means Low Sea Means Look closely, now I will explain it directly, a green When are candles made, what did I tell you guys? had told When the price goes up, the candle is green. If it is made then obviously it must have been here for Example: Price 80 and here it would have gone up to 90. Only then this green candle was formed, right? Now what happens is sometimes it's like 1 hour If the candle is of 1 hour, if the candle is of So sometimes it also happens that the market does not Instead of 90, 95 also went, 95 also went but He did not stop there, he returned as if a When the hour is completed, it is believed that this candle is 2 From M to 3M, although some in AM Trading does not happen but they believe so. This is a candle from 10:00 to 3:00. As if it was 2 o'clock here and 3 o'clock here Were doing okay at 3:00 he was on Exact 90 It has come and closed and at 2 o'clock it started at 80 It happened but it was around 2:30 on 2:30 She even went up to 95 but back when : time na so If it stops at 90, then the value of one candle The highest point is the highest point What is it, 95 is what we call high It has an open point which opened at 2 o'clock Whatever was opened on 2nd March, we will open it. Point says We will close the open which was closed on 3A. Point says okay now you will say one And so the point is here, take it and do it, okay. If the market had gone below 80 and between I think at 215 or anywhere else, anyone At a time between 2 and 3 o'clock At some point, it would have gone below 80. He would have become our low, but if below 80 If it doesn't go then 80 will be our limit, okay? Now let's look at it without price. Now we look at the candle directly on a chart. I will draw it and show you, okay now again the same Thing we have to do is understand oh lc okay Now we will not write time-wise, now we will directly write a We will see the candle, this is our candle. That means the wicks are up and down. The first thing I would tell you is Okay, this is the middle portion. it's called the body the body okay this is what There is a colored portion, it is called body and in these The points are called wicks or shadows. The shadow or shadow is formed when The market or candle started and closed if it was above or below that If the candle has gone in the middle then it means as if I I had told you that 80 to 90 candles had gone but that If it went up to 95 in the middle, then one week above Or a shadow will be formed and if it is below 75 Or if it went up to ₹ then there was a shadow or wick below also will become And this is the middle portion of our body. Okay, I'm going to erase it all now. things and now you guys have to open high close I have to tell you all these things, okay this is Question Number five okay now in this I will give you simple I am giving it to you, okay, it is a simple one. The open will always be a green candle open below the right Why will the open be below 80? So it will remain low, if the price increases then it will be 90 Right, so let's say 0 went here and up there, that middle I had gone but when I returned to the market, When the candle closes, come back and stop at 90. If it goes then 100 becomes ours, hi Points are fine if they're below 80. It would have gone, okay, it would have gone below 80, as if By 0, 70 would have become ours, now whatever Question number five will be there for you. I want to tell you if neither in this nor above If it is neither high nor low then its open So I wrote it to you guys and gave it to you guys. Done 80 closed 90 Okay, this is closed, this is open now. tell me what will be its high and low And look what will happen, this question number three It's five, okay, everyone has to answer. Three One High and Low what will happen if There is no line above or below it, which means 90 is our high It will be made and 80 will be our maximum because There is no point below this which is the highest The point below is what we will call it. The topmost point is called high. This is what happened to the green candle and the red candle. The exact opposite scenario will be red Candle opens higher Red candle opens higher It happens because it will start from 90 The open will be higher and the close will be lower when If it falls on the If this will cause him to go down, then our take will become that If it had gone to 0, then our Look, it could have been made but I admit it did not reach 0. So what does this mean, our take will remain 80 only. Our low will remain the same if it is anything above 90. If he had gone, he would have been our high but he believes If it doesn't go above 90, then 90 is our high. Okay, so the green candle will open down and The close will be up, okay? Open close and red candle open will be above The close will be below, okay, we have all these things. Explained and learned about candlesticks Look, this simply tells you that Look how powerful the candle is. As much as a candle takes a big movement For example, suppose there is a candle which 80 to 82 movements have been taken in an hour in 1 r. And so is a candle that made a range of 82 to 90. I have taken movement from 82 to 90, now tell me Which is stronger? Obviously second. Strong is right, so you will say that The market is running high right now, so you Candles indicate that a particular time Within compare to last hour market now What is running too fast? It seems as if it is falling down and has slowed down. Now after 90 you got to see that the next The next green candle is our 990 From 90 it went to 991, from 90 it went to 91, meaning first in an hour it went from 82 to 82 to 80 then It went from 82 to 90 in the second hour and It just went from 90 to 91 in an hour, now you What is visible is that the market went up but now it's stopped almost okay so this Candles tell you, now we are candles Breaking down candles based on their strength You can also have a candle party. Partitions will not be spoken in a way Candles can be categorized as I will tell you guys first The strongest candle that comes is Maru Buju Candle Stick is called Maru Buju Candle Stick Yes, please check the spelling a little, I am not I'm sure I get the spelling right, okay? If the candle is so big that no one No wick or very small wicks Well, by the text book definition If the wicks are not as per the calculation but there are small wicks Even then we will adjust it, okay? Inh Maru Boju Candle Bolte Hai M A R You Maybe Maru Boju Candles This indicates that if the green candle is lit So the market is very bullish. running higher and stronger and if A red candle appears, which means it is very bearish. This means that there are too many strings going down. these are the strongest candles okay Strung Text book definition on candles edge in this There shouldn't be any delay, but we are a little bit We will adjust with small wicks No problem, it's okay after that. Our second point which comes on the second candle Stick That Comes That Is Hammer Candle Stick This is how a hammer candlestick looks like Yes, it is a hammer brother, it is simple, it is a hammer, okay. It's a hammer, whether it's red or green Yes, it doesn't matter to us if one The market is falling and we are getting hit by a hammer. pattern one Thor's hammer okay Thor's Hammer Guess what Thor's hammer looks like This happens and this happens up there okay This is what happened, Thor's arm was broken from below. It became sticky, it became wooden from the bottom and on top I'm whatever that big is, okay, if the market It is falling down, it is in a downtrend. The market is falling down, falling down Falling down and making us watch the hammer It is available whether it is red or If it is green in colour then there is a possibility that The market started running back up, which means it is a It's a reversal pattern, okay, it's a reversal. pattern Okay, what do reversal patterns tell us? If the market is falling We get to see the hammer pattern whether it Whether it is green or red, it does not matter to us. Does it do any good if this candle comes to our attention? If it is available, it means the market can run up. This is our hammer The pattern is fine, although there are many sticks tomorrow. All the patterns are hammer pattern done The Hanging Man Pattern Becomes a Shooting Star These are hundreds of patterns that I All about your candlestick patterns course I have been taught inside but in this course I As many as one candlestick this is our Price action trading course is included. I don't want you to have candlestick patterns I will teach you because if you like candlesticks If I want to read the pattern then I have done a complete I have created a course whose i button or Then you will find the link in the description. I will go and check the description, there will be more It will be easy, you will get one in the description You will get the link for Candle Stick Patterns Course By name but my work is still for you The most important things are price action. Tell me about the related matter, then I killed you, old man. I told you about candles, then I told you about hammer patterns. The one hota hai hanging man hanging man is Same same to same our ditto hammer okay Ditto Hammer is fine even if it's green Even if it's red, it doesn't matter to us. I just remember what happened last time. What happened, the market was falling down earlier? tha ok and if we get hammered when we fall down If it is seen then it is called a hammer and it Tells us that the market may go up This time it's the exact opposite. What is it that the market is not going up first going up and then we saw a Hammer pattern named it Hanging Man Well, nothing called the Hanging Man. You guys just call it Diya Hammer, it's fine simply If the market is going up and the hammer is visible This could mean the market is down. As we mentioned, this reversal pattern so when it looks like it might be The market should reverse before the market goes up I was going, whether it was red or green, It doesn't matter if the color doesn't matter If we see this, it means there is a chance that The market may fall, so be it. Our Hanging Man pattern is also complete. I'm doing it immediately so that Sorry, it may take a lot of time, please note it down once. Everyone please note immediately our first Done Maru Bhuju which we have made in green and red Both covered two he became then his After that, the hammer pattern is formed followed by hanging The main pattern is done, after that there are many more as the inverted hammer pattern occurs Okay, now put the exact hammer upside down. Put the hammer upside down What happens in the hammer The body is like this above and weak below instead put it upside down this time this time What will happen is that there will be such wood on top and below This will remain, this is what has become of us, inverted Hammer pattern also in inverted hammer pattern The market will fall first. falling down okay and if we have this If it looks like the market may go up, it's okay. The market can go up if The market is going up first, first up and then we see that whether it Be it green or red, I will do one thing. I do this and turn it to green from the side. I make it red from one side, make it green from the other. I'll let you know, brother. It doesn't matter whether it is red or green, if we If you get an inverted hammer, it is a reversal. The pattern indicates a reversal from here. may come Guaranteed it won't come, guaranteed it won't come, but it will come Now you can see when the market falls down Later we see the inverted hammer and The market later moves up, we call it called an inverted hammer Look, the name doesn't mean anything, friend. Remember this is a reversal pattern, if you go up If it appears to be falling, it means it may fall down. If you see it going down, it means the market is going up. It could be okay, it's a simple market reversal. It was going up, it might be showing down The market may fall, it may be coming down This was seen and after that the market went up Okay, now when the market is like this going up then later we see it so we give it some other name Shooting star okay Shooting Star is not necessarily named Hammer The pattern is the same, people just give it different names. I will give you an inverted hammer Hammer used to teach but what about you guys? If you ever hear the name Shooting Star Then you will think, oh, we have already learned this. No, that's why I'm teaching you, let's do it. There are many more spinning top indices as well. candles i just got you in a flash I'll give it a go, okay now it's time The weakest candles, okay the weakest What did we talk about candles earlier, Maru? Bhuju candle which is the strongest Next comes those whose body is like this And the time is so long, okay, these are called Doji candles Or they can be called induction candles. Candles are called indecisive meanings. If there is no single decision to be made then what is the point in this? It's like here was 80 here was 81 was here 0 was here 0 There are such large movements up and down But the body is just so small, okay? There you have it, our green doji candle! Green Indication Candle Indication Meaning You have no idea what you look like What exactly is going to happen in the market? This is a very weak candle if the market If the green candle looks like this then we know It happens that the market will run further but this is what it is. No, this is a very weak candle, weak means He is not from WICK, he is from WEA. K week is a weak candle okay weak candle We have no confirmation on its appearance. can you tell whether the market will go up further or The market will go down further, so it Red is what we call an induction candle. The candle is also the same, the red candle is also exact. It will remain small and the body will remain like this Suppose there is ₹10 above, it will become 79 here. And the wicks will be as big as the top and bottom. There will be such big wicks up and down in it. You are also not sure whether the market is Will it go up or down from here, some noise No, hence this is also called induction candle. It is said that this is a very weak candle. Let me tell you guys about candles. I have explained all the basic things, if completely Learn all the candlestick patterns. Which I was telling you, if you Whether to trade on price action You want to trade at the support level What do you want to look at at the support level? You see a hammer pattern like I said it comes like this, if the hammer looks We can see the market going up from here. Right, we know there's a support level. It's okay here, it also has a support level. There is also a hammer pattern on top of it, then there The chances of winning the trade have increased, right? Chances increased because firstly there was support There is a level as well and there is a hammer pattern on top of it. If you want to learn candlestick patterns On whose basis what will happen to you another Confirmation will increase and support level will also be available. You will also get candlestick patterns Candlestick will also show resistance levels. You will also get your pattern. Chances of success will increase significantly If you want to learn that then everything is in the description I have given the links but you have to do all that in this video. Okay, after this video is complete. After we have read all the candles, now we The next point you want to read is that, now look. The first thing I just told you Those with single candlesticks say it's okay. As I mentioned about single candlestick The hammer has become like an inverted hammer Shooting star, this or that, whatever Then after that I gave you another one. Button as Doji told okay now its There are no double candlestick patterns other than Like the one in which there will be two candles like I told you inside the bar then, remember? At the beginning At the beginning of the video that if the second candle is inside the first candle If it remains then it is called inside bar okay There are many multiples like this now. There are candlestick patterns in which There will be three candles, some will have two candles. Some will have three, some will have four. It will remain like this but we still have to learn all that. You don't need all that candlestick Price will be available in the pattern course I taught him what was necessary for action. okay because you need to understand the candle Was good for price action The next topic is what comes up. Volume is okay, next topic comes up. That is What does volume mean? It's very This is a very important topic if we talk about In the case of price action, Volume means how much number of Shares or number of trades in the market I am doing it, okay, how many trades are there? I'm going to give you an example, okay? How many trades are taking place is one I give you an example as if you are you, okay Let's name you A and Purva B is ok east B is to A east of the company It is okay to buy 100 shares of Purab Company I want you guys to buy 100% of the money. Who are you guys, viewers? Viewers, my writing is so bad, man. What a bad writing I have, okay, no problem. Viewers are what they are and Purab is what they are It's gone, it's done B Mano Purab Company If A wants to buy 100 shares of and Purab wants to Purva sold it as if she had sold 100 shares. If given, what will be the volume here This will be question number six here. What will be the volume, meaning of volume This is the total number of shares bought and sold. how many shares or how many of whatever Let's talk to Let's for example one I'm making myself a little smaller in a minute If shares are there, then shares are vegetables. If it is a vegetable, then how much is the total purchase price of the vegetable and Selling has happened, this is what we call volume now. If someone answers question number six If he has given 200 then you are wrong whatever the answer is That's 100 actually what happened Purab a Meaning Purab sold 100 shares to the viewer. Sell the actual deal to the viewers If that happens then it is only for 100 shares, right? Any number of shares in a market Trades are made as many times as shares are traded If I pick up this powder from someone When given to Then picked it up again and gave it to someone else. Two powders are gone, this is the third one, okay, like this. If you buy anything and sell it to anyone Diya that is volume any number of times Yes, it's called volume. I hope you understand. It will not be too long, it will not be too much Don't complicate things, note everything down first. Do it, I will erase it after that. I'm a little tired, okay, so I I still have energy, I guess it's been two hours. OK, start the lecture. Two hours have passed since the lecture started but then Brother, I will also study with your energy. Not just anyone, everyone read with the same energy. took note, everyone took note I'm erasing it now, okay, now we I will first learn about volume. Let me explain to you the volume and price. Of The relationship between volume and price is good. I will explain the relation to you. Look, listen carefully now. What can we do, we have three such columns We will make one, we made two and this is the third one column is done okay this is our This is our price Volume This is our Expectation ok what am I doing now I'll tell you what happens if How Volume and Expectation React So whatever it is, okay, let's accept it. If the price is increasing, the price should increase. It is okay with the price increase if The volume also increases. What did we say number, what does volume mean? Done, let me erase this in a minute and do some I draw well, okay What does volume mean? How many? Shares are being traded okay if first As if in the past hour Assume 5000 shares are traded at 5 shares and even though the price was 50 earlier Now the price has reached 55, still this hour 10000 shares have been traded, which means buy And as sales have taken place, the price has also increased and The volume has also increased in such scenarios. The expectation is that the market will go up. You can buy in the market. Okay, the market is expected to go up. Okay, now if the price goes down Okay, let's do one thing, bring down the price. Not that one, now let us give a little different example. Let's take the second scenario, the price is up If the volume goes down, it means the price Earlier it was 50 for 50 when there were 5000 shares 5 shares were being traded Now when I turned 55, I got only Rs 1000. What does it mean that shares were traded? This means that now the people who buy and sell Earlier I was buying and selling Rs 5000, now only Rs 1000 buying or selling whichever Okay, that means it's in the market right now. be cautious I have to stay safe, the market may fall, okay? The market may fall, okay, one thing. We write down then cautions I write so that you people know more I understood it clearly, okay, it went down like this. Chances of market fall in this scenario and stay here Now let's take the next scenario where Price is falling and the volume is increasing now this is not much It will remain complicated for you people. Let me explain, see what we talked about volume The volume does not mean that How many? How many shares are being sold or bought Volume means how many shares The transaction is taking place, meaning the selling party There's also a buying party, now there's a thing. Understand when the price is falling Price is falling and volume is rising Okay, the volume is turning up, edge in the first 50. 5000 shares were traded then, now As if 10000 shares trade for ₹ became ₹ Now tell me what you guys will feel here But the volume has increased, meaning people are buying. Those who buy rights have increased. Now the price should go up but you Thinking volume means buying? The volume means how many shares Transaction was done which means 10000 people Sold and 10000 people bought it means What happened, earlier only 5000 people were selling There were 10,000 sellers, now the first 50 have become sellers. 000 people were selling at a price of 5000 People were selling, now 10,000 people are selling. What does this mean if the price falls? And the number of sellers has also increased. 5000 people were selling, now 10,000 people are selling. This means the price will be even higher Below It will fall, understood, if the price falls and The volume increases, understand this very carefully. Understand the thing now, I will explain it later on the chart. I will give it, okay, this is a simple concept. This is the only difficulty, nothing else is above It was easy right when you volume I was growing up, there was no difficulty in it. that's very easy okay after that when When the volume falls, the price falls. If it is difficult then the price falls when 5000 shares if traded when the price was ₹ If the volume was this much then it would be fine Meaning 5000 people are sellers of five There were five buyers Correct, what happened now when the price is 40? went so it went from 5000 to 10000 now here Understand one thing, this volume has increased by 10,000. But here it also means that first The 5000 sellers that were there are now 10000 sellers. The prices have fallen and on top of that, the sellers have also increased and when I explained that when the watermelon If the number of sellers increases, the price will increase further. falls okay now anyway if the price falls and the volume also falls volume Now it falls, understand now, now the price comes back is 50 okay before were 000 Sorry 5000 Sellers and Buyers 5000 Sellers and What happens to buyers now that the price has fallen? It's done now, isn't it? Buyers and Sellers of K One Volume What does volume one mean? That even though the price has fallen, the number of Sellers also fell, look, the first 5000 people There were 5000 sellers selling watermelons. There were 5000 sellers earlier, now there are 4000. Shops have become less, even though prices have fallen. 4000 shops have been reduced, what has happened now? The price may increase, okay, it may increase, but Definitely it is not that it will increase but It may increase because there are currently 4000 sellers. The number of people selling watermelons has reduced by 4000. If you went and did not understand, look back a little. You will understand, that's all it takes. This is a complicated thing, after this there is no It is not a complicated thing now. You will understand it by going to the actual chart. You will understand this only by going to the actual chart. If I explain it, it will be a little difficult and that's fine. Now I will remove all the indicators here. I am giving Okay, now we'll simply go to the indicators. and then click on Volume OK By the way, volume means total. How many shares were bought and sold throughout the day But that doesn't matter to us, it matters to us. that right now in an hour or for every single candle How many shares or how many trades are bought inside And there have been sales and this thing that is coming down Now look, let me show you guys first. hm pay attention to one thing There's nothing right now, look at this here. Not there. Correct one minute my eraser tool selected I was tapping the screen over and over again I thought what happened, what if not then here But look, there's nothing here now. I'm going to apply the volume tool here. Search I will go into technicalities and search. Is volume this volume we put this I am also putting a star on it and the volume As soon as I put it in, look, something came down. Been down it come Got this volume indicator now I use it I'll explain it to you guys later. Let me explain all the things like average etc. first. I will explain it ok Now let's do one thing Let's change it up a bit one day. Let's see, it will be a little better. seconds What does day one day mean now? Every one of these The candle that you can see right now is one Each candle represents a date. It is showing one day at a time, okay Each candle represents one day ADFC This is the bank which is visible below. The volume is what you can see below. Right now where I'm scrolling is fine. This is the volume now the volume, look how we Identification Now look here, okay, look here. Is happening Look here the price is increasing, okay? Prices are rising and volumes are also increasing. Let's open the first chart that I gave you guys. I had written it down and opened it immediately. When the price is rising and the volume is increasing So what did I tell you? The market is expected to go up And look, the market went up. Above My spelling is bad, please leave it. My writing is very bad, moreover I've been sitting for two or three hours, so I'm a little It has to happen like this, we have done one more thing I learned it, okay, now let's come to the next point. Now see when the price goes up It's easy, the price went up, the volume also went up. Meaning our expectations are also going up. Look back Price went up with her Volume was low here, look here. Volume has increased, which means buyers are increasing. This means that the expectations of buyers have increased. Meaning the demand has increased Meaning the demand has increased What happens is that demand increases the price. Correct When demand increases, the price When the supply increases, so does the price. Simple falls short when it comes to selling It is a bit difficult, now see. What we will do is draw that chart here. We'll do what we did with the chart. You need to create three columns, one or two and it's done. Expectation is the first, we write the last I will take that, what will be the expectation Our first priority will be the price which I will write p, v means volume, now look at one It is important to understand that volume It doesn't matter how many people have bought it. or how many people sold the volume This refers to how many trades took place. Trades or deals are made and a deal is struck. a buyer and seller for Both should be there, so look, understand one thing. When we talk about price increase then We will discuss buying when the price increases. how many people are interested in buying and When the price falls, okay, when the price falls So we will talk about sellers, understand this much Now look, the price has increased, the volume has increased, okay? After this see what happened here Price The volume here increased, it was so much earlier. After the volume increased, it meant buying. The number of people who have come has increased, meaning the number of buyers has increased. Demand increased and what happens when demand increases If you buy something, its price increases People with this have more interest in any When we talk about things, don't assume you are a shop. You go there as if it's a shoe store or Then imagine you're planning a wedding for your girlfriend. When you go to get your bag, you get the same bag. I like someone else's girlfriend He likes it and a couple of other girls too. If you like the same bag then the shopkeeper What would you call this bag if it was normally 300? When he sees that brother used to sell for five When the people want this bag, they will say 500. It works like this directly when the demand increases Then as the price increases The expectation will be that the market will go up further Now let's see the second thing, the price is high Okay, the price is a bit high here. Okay, look at the volume with this, the volume a little bit The bit has fallen, the volume has fallen, it has fallen like that I won't say anything, the volume hasn't even been increased. If it had fallen here, perhaps the market and Butt falling down because the volume here If it is the same then see the price is also the same. The price did not go up if this volume If it had increased, it would have given bigger candles. The market may go up from here but Volume has fallen, price has risen, this means The market may go down or the place may Keep it up, okay, understand this thing, let's go to the price It happened when the price increased Volume increases, meaning demand increases. And the expectation is that the price will go up. It happens that the price has increased, okay, the price has increased. The volume did not increase The volume did not increase Here's what the volume looks like when it doesn't increase. So after this the expectation will be that the price It will probably go down because now the purse For example, as soon as 00 is The shopkeeper said it was a purse and it cost Rs 500. If all the people were as many as those girls Those who liked the purse, they can go directly to the shop If he leaves, he also gets his value back. You will get it for Rs 300, right, if you buy it. The demand for the same fell as it was at six The girls wanted to buy those six Now I have become zero, so go straight back to him It will have to come to 300 or if it becomes one from six So he will have to come back to 300, this is what happened. Okay now in the scenario of price increase We will discuss the scenario of price fall. Before that, I erase a little from this side. I will do it, whoever wants to note it down, do it. Also note the example of the one with the bag. The example is good, you will remember it. ok guys now let's get after this Okay, so here it is, about the price drop. Look, the price has fallen, okay, the price has fallen. Look how big the volume is with him First look here, the price was normal. The volume was normal, it is a completely normal volume. After that the volume suddenly increases five times or Then it increased 10 times, which means the market As I said, when the price falls If we talk about, we will talk about sellers that's how many people are still selling okay Because the price in the market falls Why is it when sellers grow or people Sellers increase and the market Prices rise when demand increases Okay, so here the price drops and Look here, the volume has increased, meaning sellers grew and what we learned Sellers mean supply and the more the supply increases The price will fall further due to this the market look further down down down down When I went here, the price fell and the volume increased. Increased volume means increased sellers Suppliers have increased, okay, supply has increased. This means the price will fall and the supply will fall. Always remember that volume increases the price. Talking about demand in the scenario of And when it comes to price fall, supply What we are talking about doesn't mean that much anyway It happens but I will tell you to explain I'm staying okay now after that the price here But look, the price has dropped here. The volume is absolutely normal, there is no difference in the volume. There is no change in the price, but the price has fallen. There was no change in volume due to The market went back up, so here Watch the price drop and volume If it remains the same or the volume also falls The price will move back up on volume Here we are talking about supply. Sellers do not increase, supply does not increase The price did not fall, it went up here. But look, the price went up again. Understand this carefully, the price has fallen in the market. But look, the volume is the same, the volume There was no change in this, due to which the market and would not fall if the volume was increased What would it mean if it increased like this, sellers would increase further and then the price would increase even more It falls down, it's a bit confusing It is a topic but once you understand it then you Using volume so effectively You can incorporate it into your trading strategy So good he'll improve your game I'll try one more little Example for you guys so that you can understand completely Come on, okay, I'll do it right away. Okay, look here, the price increased, the volume increased. The market rose and went up, then after that Look, the price increased but the volume did not increase. Because of this the market got stuck at the same place. After the price increased, the volume increased and the market burst It went up, look at the price here. The volume increased only once, see why Here the volume is large in a single candle if If there were bigger candles, this Price goes up but volume here There hasn't been much change, so the market I came here and stopped, I did not go much higher. Hope you understand it better now. Don't pull it after that a little bit you guys a Take a minute break and study this chart carefully. Look at it and understand it well, then you All volume related points are over okay the price will go up then after that Volume up our expectation too then The market will remain fine and will go up Price up, demand down, we will The market will go down and then the price Supply down, volume up means supply up What happens to the price when the supply increases? falls down and then the final price fell down and the supply also fell meaning When the number of sellers decreases in a society He was going to sell 100 watermelons, now instead of that If there is only one then this one is ours The watermelon which was 80 rupees will now be sold as per your wish. This one will sell for ₹1, this one will sell for ₹120, similarly The price will increase here too because Suppliers have reduced, I hope you understand. Now I won't drag this out for long. I told you about price divergence. We call price divergence very This is an advanced concept, I have given it to you guys. I have explained it now, now you should also look at this. You can use it as an indicator like for Example, what can you do to A support level has appeared, okay? You see a support level here. I am giving it as an example, just so you understand. It's not so easy to take a little later But I'm just telling you, okay, here you are. A support level has appeared, okay, and you What do you see? There's a hammer pattern here. As if I went with him here again You could see that the meaning of candles was this The volume is also increased, so what do you see here There is support and on top of that there is volume too. Growing up when you know the price It is increasing at support as well as volume. growing, you would know that The market is about to run away and you are going to buy again. You could have made a good profit by doing this, okay? by end You must have understood profit hopefully. Price must have understood this technique as well. The volume to use is one off The Most Important Tools in Price Action The most important tools for understanding This is one of them. Okay, I hope you understand. If we talk about the next point, then we Discuss false breakouts Let me erase all this. Okay, I've erased all of that. And then we have to talk about false. We have discussed breakouts in detail. okay we've talked about Already understood breakouts, breakouts happen Now let me explain what false breakouts are. what happens so that you guys get even more Sometimes we can come to better understanding I'll draw with you and tell you okay So this is one let's say the price is here But 80 The price went up, went up, and it was like forever Price is stuck at 00 ok price The price went up and took a slight break. given out okay it was 100 here Gave break out as if you thought till 103 The breakout is now great. The market will run away as soon as a red candle appears. The market is down The market is down came down you said bye here and You have suffered a loss, now why is this happening? Look, this happened because there's a False breakout now seen, many reasons behind it There may be a reason that your placement of the resistance level was Maybe the placement was not correct or You may have created a line of resistance. instead of a zone okay you have to create a zone You need a line as I told you. There should not be a zone. That there is such a person, brother, so there is a zone It could have been, or it could have been, that the market The market has cheated you. What has the market done to you? It showed that the market would change from here. It is going to happen but the market did not turn out that way. The market has shown a breakout here. I am going to give it to you but I am trapping you here. taken okay the market came down and You have lost, okay, they say Are false breakouts a mild pain? give hope that hey breakout is coming and Instead of a breakout, the market reversed down. Let's call it false or fake. Breakouts are okay Falls or Fake breakout is okay, there are many ways to avoid it. There are ways but right now I am going to tell you the best way for beginners. I will tell you the best way, the simplest way. I will tell you that this is to be patient, patient means You don't have to become a hospital patient. This means you have to be patient now. I have to be patient, I showed you how here. Not that it gave you a little breakout. And you have to wait here, it has reached 103. What do you want to wait, one candle or two? The candle at least closes above that resistance It means you wait for one or two more candles What will you do if you get 130 Maybe he was going to meet me at 03 to say goodbye. You may have to buy but now you are on a false breakout. We were saved from the danger which would have caused a lot if it had come down. You would have suffered a great loss now. Only after confirmation of breakout is received You took my trade this way The best method is to false breakout Identification Where will the former get the profit from when If there is profit, where will it come from? Any XY root ram Shyam or some Radha, not Radha name Anything will go wrong, I'm a little bit I was taking random names but my God was in it. Let's assume that the names of When any person suffers any loss due to XY If it happens then it will go to the east from Loss itself. Profit is earned because in the market Money is not going to grow on its own, is it? What happens is that when those who have Now watch what happens as I I explained to you how the market works. Demand and demand based on supply and demand Supply means if there is enough demand It should be created if for example like that we said that when the whole colony was a watermelon If someone comes to buy from someone else, the price will increase. If only five people came instead of him Five people on five people, say 10,000 If you ask for watermelons, if you ask for 10,000 watermelons The demand has been created throughout the colony. Only these five people fulfilled the demand. Similarly, such people did it in the market too. There are those who have so much power that That entire colony means all the traders There is more power than all the traders combined. No more than they have There is money So that they can create demand if If all the traders together have 1 lakh shares could have bought 1 lakh If they could buy shares, they have the power. that it may buy even 10 lakh shares or one Even if you buy crores of shares, this is what happens We are institutional investors I, you and I are the people who are trading We are called Traders Retail Traders, okay, we have become retail. Traders who have people or agencies Institution or Organizations have assets worth thousands of crores There is money, there is money in billions which Now obviously those who have money in billions They will have people who have the right methods. Let me give you an example, that is LIC is ok LIC Life Insurance Corporation Tum People already know that this is India's biggest The biggest DII is DII Domestic Institutional investor means Institutional investors who are Do you invest in or in the market? They trade with more than Rs 500 crore. It's okay to have more capital 500 crores tell me if we watch this video If all the people who are watching If you add all your money, Can we even compare to them? Now these people can do what they are, if If you want to achieve profit then you can earn up to Rs 1 lakh. Shares As soon as the market came here, this 1 lakh shares or 10 lakh Selling shares and selling off the market okay you wanted the market goes up okay let's say we Here's what traders did: 03 Aaya Hai 03 Pay Traders Ne Retail Traders Let's place buy orders, hey friend brother running 103 arrived 105 will go 110 120 will go and we will make good profit Retail traders have sold how many shares Orders must have been placed for 1 lakh shares of Mill Mill 10 lakh shares right or 10 lakh at a time You can place an order for shares so that These sell orders are placed if the market goes down. What if I invest 10 lakh shares? The market will not go down due to these institutions who have billions of rupees and They have smart people. The team has inside information about the market We call them smart money. Well, their name is Institutional. Investors are fine, institutional. investors because they have a lot All data It is a very big team and obviously when there are billions If you are investing money then there is some reason or the other They will install it only because of this, so they have no reason. The solid ones are right next to them, inside There is information that we don't know They know what's going on inside that company. If you are buying shares of Purab Company, it is happening If so, we have the A to Z of Purva Company. I don't know, we can do as much research as we can. They will do as much as they can to get even a single straw. There is an investigation into who is working there. Who is probably sweeping and mopping there? They should also know that these people are like this. Smart Money, who has a lot of money and it You can manipulate the market to your liking Fake breakouts also occur due to these reasons Whereas these people mean your smart money. They will make you hit stop loss and their I will book profit, I hope you get it It would not have been too complicated What's the best way to fake a breakout? The market for survival went up, it went up to 103 Don't say bye, it is 100, if it is 103 then don't do it immediately. Say goodbye, wait for a couple of candles, one more. After the two candles close You can say bye as well if the below And here, as soon as he broke it, don't immediately Sell it, wait a little, give me one more If the candles come, sell at a small loss. It will be a small loss but a very big one. Loss can save you from a huge loss I'll tell you one more thing that can save you okay whenever breakouts happen okay Breakout: Who do we consider and who If you don't do it, I will explain that too. By forming such green candles in the market The candles are coming and it seems as if this candle has It is at 100 level, it was broken. Not out until this candle is complete and another candle formation above it. It doesn't mean someone is disconnected from here. No gap candles, look here. But there is a gap, isn't it? This is a candle with a gap. No one is complete and closed until Until then it is not considered a complete breakout. I will say that if you did not understand then I will explain it again. Yes, this candle is lit, consider it lit. It started at 98 and ended at 102. As long as a candle starts at 102 It is not considered a breakout until it closes. We will accept it because the candle at 102 opens Maybe it may go to 95 because of this I have to wait for the candle, I have to wait for this candle What to do if you want to avoid false breakouts Okay, now we have done pull backs etc. We had already learned the reversal. So we have learned retracement. Now only two-three concepts are left, I am one After taking a short break, he continued again. I need to have some water and then I will be back soon, thank you so much for waiting. Till now and thank you so much for please friend Like, comment and subscribe to the channel Leave a comment and subscribe to the channel I've been working so hard I keep going I have been sitting here for two or three hours, I don't know. How much time has passed, I don't even have time I know when I started the video, how much I've covered that so far and there's more to come. If there are things left, wait a little. Have some patience and we will continue in a While Thank You You are okay and I am back, take some rest. It was good if I took it because I also got energy. I'm back and I'm able to tell you all Things came back to mind, what was left? What all has happened, what all has not happened, actually rest I just had a two-minute plan, but it Turns out I took a 30-40 minute rest. I took some tea and drank it because It's 8:00 in the morning I haven't slept all night because of you guys I'm here for a second to teach people I couldn't even rest, I slept the whole night without wasting any further time let's get Started Only a few points left Only a few Topics still left to be covered The rest of our course is complete. So let me first tell you that something Points that remain about our volume If it happened then they complete it first. Of course, there is one thing I need to tell you very much. is about volume and demand that if At the same price if lets say for Example one second Yes, at the same price as Let's, if many Just because there is more demand doesn't mean That the price will keep rising let me give you An example that if for example 00 Priced at Rs 1 lakh Shares, okay, buy even 1 lakh shares or else Just because there is demand, it does not mean that it The price will suddenly increase, okay? 1 lakh is not too much even if it comes to 10 lakh. If it goes then it is not so that its price increases immediately. It will increase a lot if With increasing prices, volume and If demand does not continue, it means price And it won't grow like I did with a watermelon It was told in the example that even if at 80 Ask for 1000 watermelons, okay if they cost 90 If 100 watermelons are not asked for then its Price cannot increase, this means price There should be demand even after the increase Okay, like if it's 85 and suddenly His demand dropped to 50 or 100 If it happens then from here the price will increase to 86 Thereafter the demand could not increase Because of this the price will not increase as it is late. I give you an Example If 00 But let's assume that the normal demand is 10,000 Around 10K but suddenly in demand It increased to 1 lakh, it increased to 1 lakh This does not mean that the price of 450 The price will go away or the price of 500 will go away The price is wrong, a little more than the first 400 It will increase to 410, for example, now it will increase to 410. But now it is important to know how much demand comes. Is there a demand for 410 as well? If not, If it comes then the price will not increase from here. It will do so even if we get Rs 1 lakh here. Instead of that if it was for Rs 1 lakh For example, if Rs 30,000 had come, the demand would have been Rs 30,000. It would have come at a price of 400, then at 406, as if And there would be a demand of Rs 30,000 and then after that We can see 40000 even on 410 demand is okay 30 30 60 60 and 40 1 lakh Right 410 also has a demand of 40 then Its price goes up to 415 or 420, okay? Just because even if it is worth Rs 1 crore for Rs 400 If demand comes, it is not that immediately Price will increase with increasing price As the price increases, so does the There should be demand even with rising prices If you want the price to rise, it means It is not that if for example one If you are an institutional investor, this chart For example, this price is 100 120 140 So it is not that they spent 120 Suddenly it was as if I bought 10 crore shares. So it will suddenly go for Rs 4000 or Rs 00. The price will go away, this is not how it works 120 It will go to 140 before, there will be buying at 140 also. There should be demand here too, then and the Fard will go up to 160 and the demand will be 160 If it remains then it will go to 180, that means with increasing Price demand should remain if demand A lot comes at just one price This does not mean that Price is running away. It will go away, okay, someone please note it down. I haven't noted it, so I did I have drawn such a thing that no one will understand anything But I will do one thing, clean this area a little. I draw it well because this was an important factor okay I'm a I will draw this one and tell you again. I will give it to you so that you can understand it better. So it should be understood and clear, okay? If the price is ₹1, 120 or 140, it is fine. It is 160 for example, it is not 120 But if a demand of Rs 1 crore comes, Rs 1 crore If there is demand for shares, then immediately It will cost Rs 300, not Rs 120. First 140 will go, there will be demand for 140 also. It should go from 140 to 160 and then to 160 also There must be demand if demand is increasing If demand falls along with the price The price will not increase like we did with watermelon. I saw in the example that earlier the demand was 120 As soon as it reached 140, people started saying No brother, we are not buying it now. He said that he is not buying it now when there But if demand falls, the price will fall. ok i hope this point is clear then After this we have very few points left. The first point we have left is that Retest I don't know you guys Have you heard the retest or not? breakouts happen and then After that, before our actual retest. Let's do one thing and cover those points. Support and resistance with no What happens when any support breaks If he does, it becomes resistance and If any resistance is broken then it It becomes support, what is he saying brother? The complete Let Me Explain Let's Say For Example: A chart with a price of 60 He's stuck in the middle of 100, okay. It's like he's spinning, spinning, spinning and so and so and he gave a break broke out okay now break out did it went up went this happened that happened now what It happens that this is the price of 00, which We had resistance before, now it is new. becomes a support brother why is this so how what if east The market will come back down from here. The market took support here and moved back up. Maybe why but why why look understand I'll go back two steps, okay, two steps. Let's go back a little bit and see what happens now. I went there but people did not know about the resistance. There were many people here placing sell orders. They were sitting and had to sell it to the people who sold it. I had applied, okay, those people failed. It failed because the market ran upwards. Gone is theirs now Loss is okay, just remember this thing, nothing else. no okay now some people here Got a breakout Those who got a breakout B He said goodbye, meaning Demand created Meaning The price has gone up a bit, correct now. People did not buy on breakout here This happened to those who did it correctly The breakout was monitored by people I had not kept an eye on the breakout, now they too It was seen that those who broke out I took the trade, brother, the price went up. Here he took the trade on the breakout now Price went here which people missed out People who did not get the trade No, now those people have become interested, okay now that People did not get the trade, they Also because fear of missing out This is what we call FOMO is visible to other people, friend. I am making profits in this trade. Why did you miss out on a trade? This is called Even those who said goodbye to FOMO I missed B He also missed the breakout. Buy demand created, price increased again grew up okay now what happened along with that People placed sell orders, okay, sell. Orders were placed at the resistance level But it's okay, those who lost it now There was a loss, now they have to recover the loss. They feel that when they are so above 100 If it has gone then when it comes back to 100 then If I buy it, I will buy it and this Once again, we can recover what we have lost. If you take it and earn profit then everything will be fine right now. People had taken on the first breakout Those who took the trade for the first time, it is okay Because when he gave us a breakout of 100 It looked as if he bought it at 03 book profit Okay, now he waits. As if it went up to 120, they made a profit He exited with profit. He did it and made a profit of ₹1. Now what happened, you made a profit of ₹1 Exited now that the sale is done. Meaning, whatever he had bought, he had sold it. I did it now because the sellers are increasing. The market will slowly come down. Will come down now see whose last time loss It happened that he was waiting, as soon as 100 I will buy it because it will last I lost time last time I sold it thinking it was resistance, now I am buying it. The market will bounce back from here. they're just thinking okay they thought And said goodbye to her here for the last time. Time who bought at 13 and sold at 120 They also booked profit when they sold it. They too are feeling the market now, friend. 100 has come into the range of 120, now back to 100 When it comes back, we will buy it back. will make a profit and those who bought late It was the last time, okay, what people said I did it for 103 but I didn't buy that little bit. He stayed patient and remained as if he I bought it last time at 115 and he I regret it a lot, I bought it for 115 I wish I had bought it at 102 or 100. There would have been a profit of ₹ what is happening now All three of these trees will be new and fresh. Entry will come ok Which fresh entries will come, who had previously sold on resistance and whose There was a loss because the breakout occurred. Okay, one who bought at 103 Those who took profit now and profit back and those who have done it too late He had taken entry and now this time he is on time. Earn big profits by taking entry want to make profit So as soon as the market is back to 100 Will you come around now? Enough of the mess, okay? Now I'm going to erase all this for a bit. If you want to note it down, do so because there are so many I don't know how to explain in Khichdi, okay I am erasing it, please take a screenshot brother. If you don't want to note it down then it's fine, I am erasing everything now so it is fresh. Entries will come around 00 and as soon as this Fresh entries will come around 00, see. What will the market be like from here? Wait a minute, let me just say something right away. I am erasing it so that I don't erase anything wrong. Let's go okay, no one, if the market is here had gone up above, after that as soon as If it comes around 100 then all these three parties Now she will enter back at 00, she has returned Who bought it first, as if one party He bought it, his demand came and he bought it. Placed orders, their demand came second Party Buy Orders The third party placed a demand and put a buy. Demand came and now there is another fourth party Those who did not trade last time who had taken it and had not sold it Those who said no saw it Dude, the breakout came at 00 and went till 120. I went this time, don't miss out on 00 okay this one is also a victim of fomo Fear of missing out, why did I I did not take the trade last time, it was at ₹1 Will buy back now there are four participants Those who are going to buy have gone because buying is happening. It means demand is increasing, so demand What does it mean if demand increases? The price increases and now the price is back to ₹1 She got up and went back upstairs. What happened now? Look, last time there was a breakout at 100. Took support at Rs 100 and now take it people We became confident that 100 is now ours. The support level has been formed because First a breakout, then a breakout After those who were interested first party, second party, third party and fourth Parties who did not take any trades He was a victim of FOMO and he also took the trade Demand came, profit came, market came back up It seems as if this time it went up to 110, then now people Who knows that when it comes back to 100 I want to buy it back because now is the last time What will happen? A fifth party will come fifth. Another party will come, another fifth party will come. When the bar comes back down, which party will it be? who still haven't taken the trade Who did not breakout even the first time who did not even try to do it the second time Now he will take it for the third time, so now more The number of participants increased and this led to a 00 Which is our support level now. I don't know how much you guys are in this mess whether you understand it or not because I make a lot of mess, but I hope Do you understand? Five parties will come now. And now because of this 00 has become our support level. It will go well anyway if there is any resistance Level breaks happen as we just saw The resistance level was broken and later The support level has been formed, okay, the support level Why make it, look it is simple first There was resistance, the market came, came, came. I braked, touched it, okay, previous The number of times people traded here Those who entered very late He had taken entry and he took entry back. Brother, you will make good profits this time. who sold here okay They also entered and those who traded did not take any trades did not take any trades When he also entered, there were four new ways People came who entered and the market Now it has gone up above the resistance of ₹1 earlier This used to be our price of 100 This used to be resistance, now it's support. It will be made because it already took a bounce Now when he comes back down, these four people will So we will remain and it will become plus one. Those who did not take the trade this time also Five people to take trades now Five people s in five different parties five parties A in those who did not take the trade Those who made profits All five who made less profit People will come back, support will be built again and 00 Now we have a support level, I understand. Similarly, its exact opposite happens. At the time of support level, even when the support level Breaks are okay Support level when let's say for example this This is a market, this is a market, this is a market It is as if the market is at a support level. Better let's do something on my face It's gotten very close to okay now this market This is something like this, this is the support level As soon as the market broke it After the market broke, what now This is our support level, okay support level This time it was the first support level, say 0 Let's assume the price is okay this is Support the exact same explanation As resistance became our support We had the same support after the breakup Resistance is created after it is broken. 60 point is now this will become a Resistance where same as Parties can participate again and this I hope you understand how it will make a profit I hope everything is clear exactly On the contrary, brother, as I completed it You gave me an explanation, it was exactly the opposite. ok this is clear i will erase it I give you what people haven't noticed yet I have done it, note it down immediately, this is the Exactly the opposite, anything is simple, absolutely It's simple, don't worry about anything, it's okay Now we will learn about breakouts and retests. After that we have to learn to trade on gaps If people don't know the gaps then I Before I explain the gaps, let me do one thing. Let me explain the gaps so that you can learn a little about The concept should be introduced first and then So let's go to the retest, okay my friend. I am getting charging issue while charging I had installed it and the charging became very slow. Come on, no one will give me this last time too Actually the video had to be stopped because Because the phone was not charging, it's fine. I just erased it, hopefully everyone noticed it. You must have done it, okay, now on to the next point. If we go, we are taking the next point. of gaps okay gaps or however we call it will say Price Caps ok good now see how good my writing is It's feeling good, you've got some energy, right? I needed tea, my friend. I needed tea. Because I have full energy, okay let's go So look what happens now, I've got you guys A green candle is a red one There is a candle, come let me draw it and show you It's a green candle, it's like it's on It started at 0 and closed at 30, then after that Now it is closed at ₹ as if it is one by one Let's turn on the hourglass candle one by one 10 AM to 11 AM, okay? It is a candle with 10 to 11. First The candle will then remain for 11 to 12 seconds Candle 12 to 1 will be the third candle 1 to 2 The fourth candle will remain, okay, I understand, now from here As if 20 became 30 from 30 As if this is our second candle that opened on the 30th. this This is one, okay, this is 35 pay close now. After this it closed again at 35, then the next The candle will obviously turn at 35p and it is as if Close at 40 This is our candle number three, this is 35 It started at Rs 40 and now it has closed at Rs 40. Look, this one is simple, it started at 20 and turned 30. But wherever it ends, it will be his. As soon as this one ended at 11 o'clock and At exactly 11 o'clock, a second candle went out. It will be fine, exactly as soon as 11 o'clock It will close and it will work for a few seconds. The candle will light up, then the third number When will the candle be lit when at 12:00 our The second candle will end at 12:00 seconds At what price did our candle end? 35 The next candle ended at the same price Ours started at 35, what happened now? The fourth candle is right at ₹ Our candle closed at 1 o'clock at ₹ This third candle closed at 1 o'clock. It's done, okay, it's going to close at 1 o'clock. The candle closed at ₹10 but the fourth number It is a candle of I don't know, it is from 50 It started from 50, it started here, so much A big gap has been created, look at this fourth Our number candle is from one to two o'clock The one that suddenly turned 50p was so big Gap created tell me when it's 1 o'clock 4 Pay price has closed, this is Purva Company Okay again Purab Company So the price of Purva Company closed at one o'clock. 0 and 1 o'clock, as if within a few seconds How he reached 50 is the price Gap Price gap means from one candle to another Creation of a gap between the candles Now always does not mean always but usually It happens that if it is a candle from ₹12 If yes, then the next candle will start from ₹1 only. Because this candle is candle number one and candle Number two takes just a few milliseconds. There is a difference sometimes but it happens like this Something so big can happen in milliseconds. goes So that a gap is created, what happened, the gap It has been created, now see how many times it has been found There is a difference of seconds, sometimes different There are reasons too, let me explain them a little. For now, I'm just going to give you the basics. I am explaining it like this, okay now price gaps There are some reasons behind this, that is first aggressive Buying and Selling if you tell me exactly this Suppose the candle ended at 1 o'clock and this candle Started exactly at 1 o'clock, just a few seconds like millisecond one second late okay one seconds late, as if this is just 1 second after a b If it closes at 1 o'clock, then within one second If there are a lot of orders at once, then Because of the region, I am not talking about my region right now. If I had accepted 1 crore orders Yes, if we get 1 crore orders The price will suddenly shoot up, right? A little aggressive buying within seconds or This also happens because of selling, now see many This is not a game of seconds, I I told you like that just for explanation. But sometimes this aggressive buying and selling It's not a matter of seconds, it happens like this Just before the closing of a candle Orders are implemented but those orders It takes time to get close, that's all you Don't think technology is none of your business. You have to understand why gaps occur first. Reason is aggressive if buying is done or else If there is aggressive selling then there will be gaps. If aggressive selling happens then A gap will be created downwards, meaning it will be red. A downward gap is created in the candle Look, this gap has been created. and if aggressive buying happens then it A gap will be created on the buying side, okay now. Apart from this, there are other reasons due to which Gaps are created so far note down If you haven't done it, please note it down. If you haven't understood the price gap, I'll give you a Let me explain a little bit more, okay? I will explain it line by line, it will be better, okay line I will explain it to you guys through a chart. It will be easy that way okay to understand like this is a chart that right now It was the 80's, okay, it went up and down, up and down. It's gone here, it's 0, it just disappears. It started from this and this started from this, so this is in between A gap has been created, this is the gap Called as Price Gap: Although there is no gap in the line chart But to explain it to you, I will show you a line chart. I'm explaining, okay, look at this, this middle. The gossip that is coming to me is called Price gap and this comes region number one aggressive I am writing Buying and Selling B&S You guys can write the rest, it would have been a second. Any news is because of its news impact. Brother, some news has come, think about the market. It was as if something was going away, something was going away very low and wait a little bit elsewhere I draw a candle on our second chart. coming in the middle of okay as if this chart I was going up, I came down a little bit I came down a little and suddenly the news came that Very bad news has come about a company. As if it was a scam worth thousands of crores gone or as if whatever happened is okay It's like the bank has been scammed. If such news of thousand crore rupees comes then The price of anything will not drop suddenly. Just like it was here from Let's to 80 100 went here, 90 came here and immediately From there it came down to 70, a gap was created in between. okay this is in the line chart I just am explaining for the sake of explanation whatever You have gaps in the candlestick chart But candlesticks are visible in every If I make it, it will take a lot of time. Such gaps are created and these are called Price gaps and what we just saw was this Because of the news, if suddenly some news Has a scam of thousands of crores happened or If something happened, suddenly a big thing appeared inside him. A sharp fall or rise could be good news. If it comes, it will go up. If bad news comes, Obviously the price will go down because of this. Grape is created in the third phase of the market. Reason for the sessions This is especially true due to market sessions. Talking about the Indian market, Indian What are markets like I told you? Told people it's not open 247 If you want to trade in the stock market If you want to do it, it doesn't happen 24/7. There is only a short time to trade here. Like the market will open at 9:15 and at 3:30 If it is completely closed then from 915 330 is the market, what happens now, believe it today It's Monday, okay, the Monday market is closed. Now even after 3:30, people are not placing buying orders. They can keep it on if they feel it is okay. that this stock is going to rise this is going to happen It is like this and keep those buying orders. If you can, what happened next day? 915 The market will open on 9155, there will be demand till then It will be created either by demand or supply If supply is created then The market will open lower if demand If created, the market will open upwards Similarly, this is the gap between the sessions. No, this gap that we have is one second I change the color to fill this gap. has gone to the beach Yesterday was Monday in between market sessions in Today is Tuesday, whatever demand in between Or because of the supply created A price gap is also created if demand If created, the price gap will move upwards like this It will be created if the supply is created So all our price gaps downwards I understood it, I hope it is clear would have gone There is another reason why price gaps occur. Can be created to be actions, these two Gaya and the third one I wrote was about market sesh. Because of market Sessions and then Fourth Is Smart Who is the smart money because of the actions of money? Did you forget what I explained to you brother? Smart money is the people who have The capital is worth thousands of crores in billions Capital is these are institutional Investors who know about the market Smart people know things we don't know They probably know who among them does the sweeping and mopping. is investing in that company, in that company if When he is sweeping and mopping, he is in the boss's room. What am I hearing about all these things? They know, okay, they need every single thing in the company. Only after knowing the thing, he can trade there. If you do it, then if the smart money wants, then absolutely If you create a lot of demand from someone From the region, so up there A gap will be created if the supply If you create a lot, the market will go down. While falling, leaving a huge gap at the bottom. If it can open then smart money's actions Gaps can also be seen in the market due to this Now that smart money is buying the gaps. This will make it so that I can explain it to you slowly first. Note this much, okay note this, Jin People did not notice my 5 in this It is charging, friend, I hope I complete it. Lou his Well, there's not much left right now. We learned about gaps. I learned a little bit about I have to tell you about the retest now. I just want to say a little bit about gaps. I'll give a small revision and then I'm going to move on to retest, okay, I'm not I want my video to end midway. Or it may stop midway because charging If not, then hurry me up a bit. You will have to see now, we have just learned about the market. What kind of gaps are there in work, use white color so that This is a chart to make it easier to understand. This is the chart, it's going up all of a sudden. This gap was created in the middle of the candle. This is the gap that I am drawing in yellow. Let me make it a little easier to understand Let's go, this is what we drew in yellow color. There is a price gap here when this candle closes If this happens, it means the next candle will also be here. It should have started but there was no gap in between. Okay, this is a bullish gap created. Because it creates while going upwards It has become bullish gap and similarly gap if downward direction I would open it, we do one thing with Red. Dr. will make it easier to understand This red market is going down and You can see it here in the middle Yes, the gap was missed, so this is Bearish. Gap and we know four regions, the first region is Aggressive buying and selling is fine B and S then the second one is because of news news It will obviously happen on the news if suddenly If something comes, if something good comes, then move upwards A price gap will be created if the situation turns bad. A price gap may be created on the downside The third is because of the market session Because our market is not open all the time So when it closes, the demand in it End supply is created the next day when When the market opens, that demand will suddenly increase. If news of supply means impact will come This can create a gap up or gap down. If a gap is created in the market towards the upside If it happens then it is called a bullish gap or simply gap up in the words say okay and Below and if we get to create a gap Or if you see it, it is called gap down. Okay, understand this much for now, the rest will be on these. I will explain how to trade it up front. Know about market sessions ok And the last thing I told you was if you were smart Money, whether smart money, means institutional Investors are fine if they want to. can move the market so that the price Gaps are created, it's okay, note them down immediately. Price moves on to further topics in How to trade gaps is our guide There's still one more thing left for us to do. That is retest reading yet to happen I Price I have already told you about the gaps. I will tell you about the retest and then later How to trade price gaps I will tell you, okay, it's simple, the price How to trade gaps There will be a full video too, don't worry. There is no tension for you brother Brother, please teach me everything right now. I will tell you a little more about the gaps. It will go over your mind, first understand this much Understood about low gaps, take note Okay, done, okay, now we have to Option one is to directly use gaps. I can teach if I teach in a mess I want to, but I think it would be better if I go first. I teach retests, I remember only this much about the gaps. put okay what are gaps what are not I will do one thing if I want to. How to trade gaps up and go long I will bring the video separately as well but still I will brief you a little in this video also. I will give it, okay, just a little charging issue Like this and I might be a little bit of a I have to wait for two minutes, okay? Let's move on to the topic of a retest. What we learned from doing is that if any support If there is a break then that will be done later sorry just a Second, I said it a little wrong, I miss spoke what we learned earlier that if any If the resistance is broken then later Go and become a support, become the right support So that he can take support and go to the market. The market can go back up just like that. When a support is broken, it moves forward This creates resistance, which causes the market to The market moves down after hitting resistance Right, whenever there's a breakout ok whenever there is a break out As if this is a chart, it has its own resistance above This support below This support above This resistance Right market up down up down down some was doing and here he broke Well, the market did break out, but What did he do? Come back down. Now see if he moves a little. If we come back down then that is the new level. One can test it so right now that support can become Either it is a fake breakout or can go back down okay remember fake I learned something called breakout, if here okay if he takes support from here Tests this level Tests this level Testing means we test it retest says ok test again He now resists what he had before tries to build support okay Previous tries to build support Resistance, okay, that was resistance now. He will come down and test this level if If she gives support then this is a new support. It will be okay if he doesn't support it. So it's back to showing a fake breakout and it's just A false breakout will occur and the market will also He is still in trend, understand me. whether I understand it or not, it's okay I'm going to explain it again one more time. Correct It's like this resistance level is support. This is the level, the market was moving up and down. Up and down, up and down, gave a break out After the breakout, the market comes back down. It felt okay, it started coming back down now. When we started coming down, our first This was resistance, now it can become our support. It can become correct if it is supported If it goes up with support then it becomes support It will be fine and if it gives fake breakout If it comes back down then it is not support This support will be cancelled and now Our resistance will remain alive and if It takes support if it takes support If he takes it, it's a very good entry. For a trade it is called Retest Trading The strategy is fine, although the breakout end Retest will say because first breakout Breakout happens when it is not direct It comes down and becomes a support if this It takes even a little support to go up There is no need for even a little bit as soon as here Took support, we saw a couple of green candles After that we immediately took entry and it was great. You can book profit in the same way On the contrary, if the market moves in the downward direction Wait a second, first you guys take note of those People did not note it, note it immediately I would also explain with the example below. Okay, I noted it down, done, I'll move on. I'm growing up, if the same thing were happening the other way around Okay, reverse edge in market if support It used to brake as if it was the market He broke the support, he broke the support What happens after he breaks up? There are many possibilities, it could be that Dakkad Direct Break Out From Here He may test this level again which We supported him in creating resistance. Try it, but now that attempt fails. If it happens then we will not call it a breakout. We will consider it a false breakout or fake. Consider a breakout if this attempt fails It happens but if he tests this level takes resistance, meaning bumping it down It goes as if it had previously given a down breakout Then give a breakout and find the meaning of resistance went to the old support which was new Resistance can be formed if it Gave resistance and hit the chart from there If it goes down even a little bit, we are in for down. Can take trade Open trade for down can do this is called breakout end Retest Trading Strategy Just Give Me One minute I charge it and start the video again turn on
1 year ago
Pending
A retest occurs when a market, after a breakout or breakdown, returns to the previous support or resistance level that was just breached. If this level then acts as expected (e.g., former resistance becomes support and holds), it presents a trading opportunity. If the retest fails and the price reverses, it indicates a false breakout.
Now let me give you question number three. Giving people the answer to question number three Yes, you guys should come immediately. Hope you drew it, wait, I'm about to draw it. I'm giving you guys two minutes Make all the notes of those who I did not make notes right away. Make it okay now I will erase I hope everyone took notes. You must have made it, okay, hope full everyone. became notes of Okay, now I will ask question number three. I am giving you the answer, you give it to me Is This is question number three, let me ask a I will talk directly with the price. is ₹ and as the market went up it came down went down came up went down came up came down went up went down came up went down okay this is it one This is done with a This is Let's ₹10 out of this What is support Having more What is the resistance between 120 and 60? What is support and what is resistance? Three, okay, otherwise I will answer it. I won't give it to you, just comments. I want to answer you guys, support What is it and what is resistance to you? I have to answer right now, okay now we We will come to an important point about this. Support and Resistance SN R Cain B Angle Edge Well Angle Edge Well means what happened brother what does angle as well mean Let's explain it, let's start from 0. For our people to understand, okay, this is 0 The price is the market, it went up and down. went down went up came down went up came down 6 5 70 75 Now look, some trend is visible 80 If you look here, there is a line like this Let's add okay one second no my little If your heart is being touched then repeatedly turn on the screen What if we move and add a line like this? This is not becoming a support okay and If you look at the price difference of every 55 If it is being made on this site then it is a complete proper Our support is becoming right and so is Let's say above it is 80, 85, 90, 95 So should the support and resistance angles. It could be like this and it could be like this This is a what we learned first That is ₹ ₹10 now what happened this time 60 65 7075 This is our Support This line became our support and Similarly, what happened in the Resistance? The upper line in the resistance If it happened then I hope you would have understood. Resistance and support levels also in angle and such straight horizontal ones can also be Such straight lines can be horizontal It is said that this is called an angle, okay. It's simple, there's nothing much to it, just draw it. Make two notes, everyone, immediately. Make notes, okay, I have made notes. I am erasing Okay, I've erased everything, now we're Next we will study the next concept about SNR in SNR is Never A no just never just write we will okay Never Just a Line It is always a zone as I am writing all Things are not written like that, you have a zone and Range what would that mean that I just now Simplification ki tumko a single line It's okay, but what will happen to the market? There will never be a single line in it, meaning How about if there is support, okay? I draw and tell you more like that Simple will suit you guys. If you are looking at this then this There is so much zone from where the market repeatedly Taking support, agreeing to a number If this is a person between 80 and 82 years old then What are the support and resistance levels? Nor are they always made in public, ever. Not a single line is drawn for better And let's get the best results if you Because what happens is sometimes a little There will be a difference in points because There is no such thing as perfect, right? Brother, as we say, it seems as if you have no He asks, brother, how much will this thing cost? He says let's buy potatoes between ₹50 and ₹100. Those who are in the middle will come for the middle. It happens the same way if you look above. There's a zone like this up there as well. Because its point is different, its point is different Its point is different, its point is different Look, these two points are a little different. If it is different then there is a zone for this Support and resistance are always drawn in the zone You should use the Rectangle tool for this. You can use a lot of things for this You can use the tools I give you when If I go to the chart, I will explain it, similarly when such There will also be a chart, right? So, it is such a There will not be a single line, it will be like this usually There will be one zone, okay, this will be one person like this. Similarly, look above also, there will be such a zone In which margin of errors is your saving grace. what happens is that you don't We can say that the market is exact at this point Only if he comes will he go around here. You can also take it here, okay, I mean Whatever support you want to take, it should be at this exact point. whether it is a little above or a little below So we always create a zone. Okay, he won't take it at the exact point. Sometimes a little up a little down a little bit So there will be a margin for error, friend. If margin is there then support and resistance I am always in a zone right now, I am you You know, tell people all this by drawing. Because if I'm on the charts right now If I go, it will be much longer. This video means I don't think in 4 hours It will also be complete again, okay, let's do this. Another one of our support and resistance points is gone. Important points you need to know Then there were Examples and Depictions. I gave you both and then After I told you this horizontal It could also be this angle, it could also be this I also explained the thing A. Support and resistance areas that occur How this can also be labeled as demand and supply We can also call public support as demand public. Are and resistance We can also call it supply people. Why look like we talked about it when When demand increases, the price increases. When the market repeatedly hits 80 If it is coming then what are people doing at 80 They are saying goodbye, they know when it reaches 80 It is also coming, the market is going up He said buy here, meaning demand. created due to which the market went up So we can also call the support zone as demand zone. Similarly, when the market repeatedly moves above 120 But if it is falling down then what can people do? The sale is going on at exactly 120 We are paying tax, we are paying sales tax meaning Creating supply and supplying After we learned what the sellers increases when the number of watermelon sellers increases If you go, its price will fall. The price then falls from 80, so it increases Because there are many buyers from 120 It falls because there are too many sellers. Because of this selling point that is Resistance point buying point meaning Support point hopefully this is also clear must have gone okay how to trade with support and Resistance as a Beginner if you Trades based on support and resistance If you want to take, then see how you should take trades Support and resistance are very easy Taking trades on the basis of but I am a simple I will tip only on this basis. Not taking a trade No trade Sorry brother, it would take time to write that. Yes, but this is important, that's why I'm telling you. Only support and resistance One does not have to take trades on one basis or the other. Confirmation should be accompanied by one thing You never get your full money on the basis I want to see at least a couple of other things. Which gives you confirmation that brother, it is like this. It is going to happen like for example, we will After some time, the patterns of candle sticks candlestick patterns If you add this to it, you have Now there are two confirmations, now the first confirmation This is the second confirmation, now that both You can take the trade once you get the confirmation. Okay, this is how you can take the trade. Let's take a look at the chart Because I don't want to give up anything It will take more than a minute, is it two minutes? It will take more, okay, so now on to the chart. we come Now I am going to tell you the support and resistance levels. I show people, see if we talk. So simple let's see here where more Easy on will go a minute look if we talk here But this Look what has happened, this is question number four q4 what is this question number four this What Is tov yes this is Support Support If we wanted a level, even a single line would be enough. could have made it okay make a single line Could have looked like this, but somewhere from here I have taken support from somewhere, I have taken it from here Have you ever taken it from here anywhere? taken from here, ever taken from here There is a slight difference of points, exactly. There is a points difference, so there is always a zone. Something like this is created, a zone is created It is said that brother, somewhere in between this Support can also be taken in the same way If we look at resistance, there is an angle in it. Look carefully at the resistance Look at one such angle resistance in which Sometimes taken from here, sometimes taken from here Sometimes taken from here, sometimes taken from here I guess I didn't draw it right. Okay, there's an angle resistance, so like this. There is a support and a resistance Hitting resistance in the market It comes down again and again, it comes crashing down It comes down by hitting the support goes up, bumping, goes up, bumping goes up got it okay two minutes It took a lot but I also told you guys this I explained it, now I explained a new thing, one more thing, okay. Now let's go back to our screen. My face is back in front of you guys It must have been and now I will take a look and What are the next topics so that we Don't miss out on anything, maybe right now Start the video and it's already been one and a half hours. It is done and we are proceeding forward To the Next Points Okay, an understanding approximation. Risk is basically the same thing as approximation. I will explain it to you guys at the risk When we talk about charts, Exactly, yes exactly from this point It is not necessary to take reversal, you will think that I If the exact result comes here then I will say goodbye, see. You thought he went from here on up. I will come here and say bye, then I went downstairs I thought I would come back here and say bye downstairs. Went here and came to the exact point here and went down as if here and If it went from top to top, then one There is a risk of approximation if If you go from the exact point then there is risk. It will remain the same if you create a zone that From this zone to anywhere in between If yes, I can say bye then you will miss me. You will not let anything or anyone out of you There will be no problem, similarly here also there is a The zone will be created, okay, I have made a little more zone. made it bigger A zone will be created here as well, okay brother. Look, it happened somewhere here, somewhere here. It happened here somewhere P It happened here somewhere P If one person comes here then a zone is formed. It's okay, it should always be done in one zone. Other wise there is a risk that one trade Miss it or the trade goes wrong Okay, I'm sorry I left without you guys. I drew it and erased it, you guys draw it. immediately in Two one drawn, okay Good, I hope everyone is taking all the notes. Because this thing can take you anywhere You will not get the paid courses you want. You guys can buy this much knowledge. I am not going to give it for free, please. Understand that no one is going to give it to you. The next point price reversal is always Not guaranteed, look at support If the market comes, it is not necessary that If he reverses the price from here, that means The price of 80 was running here again and again. He was going up after hitting it at 80. Meaning it is not necessary that it will remain at 80 every time He will break it someday, he will go to 70 someday. So 70 will go upwards in the same way if If it was at 100 then someday it will reach 110. Reversals are not guaranteed, write this point down. Reversals Are not Guaranteed that if it reaches support, it will definitely go up. will rise or will it fall if it encounters resistance It will surely fall, it may even break it. As you remember a while ago I You guys break out and do something What breaking out taught me I was taught that my mother told me to go and buy potatoes. You are going to buy potatoes, right? So potatoes 50 should come between ₹ to ₹ but as if someone Due to the region its price has increased by ₹ aa If you go someday, there will be a breakout, right? The number that comes here should be reversed from 0. She should have been around 50, but she She did not come and did not give reversal. From the resistance which was our 0 He broke the resistance without taking any action. This is called a breakout. Okay, now I understand. You guys are not guaranteed a reversal. But majority of the time if you guys do it the right way Learn to study price action from You will understand when the reversal happens. When is he going to take it and give it a breakout? Learn more about breakouts. I will understand okay next a as I talked only and only support and Not taking trades based on resistance There is someone there for you, one or two more You have to see the confirmation like for example You might find a nice pattern there. gota chart pattern gota candlestick You guys got the pattern by the way and If you want more courses then I have provided complete free courses. of cost to you price action I have created a trading course and it is still being made. Then with this I have done candlestick patterns I created a trading course and then with it I I created a chart pattern trading course People created intraday pattern trading course I am selling such courses for lakhs. Sitting for so many hours just for you people I am giving these courses for free in return. I don't want anything, please like and comment. Subscribe Subscribe to the channel friend please please please please a little This is a request for your younger brother's channel A little bit of mind is that friend YouTube impacted the lives of 1 million people I have to do this, this is my goal, okay, so let's go. We have talked about these things, now let's talk We will talk about trading with breakouts. okay now we'll talk about trading with Breakouts We've covered a little bit of breakouts Got it, now let us discuss breakouts in detail. After this we will understand many things and many more. The thing we have to understand is I have lots of things For you guys and it's going to be great Don't worry about lectures, I have the energy. I still have energy, brother, by creating energy Keep the energy up, this is going to be One hell of a course such a course nahi you You will never see it nor will you ever get to see it and There will be no one left either, so just wait for me And let's move on. Next is Trading with b I'm writing it b this is Breakouts and BD that is breakdown okay It is simple, the market is when a support or breaks the resistance right when When it breaks support or resistance The market will travel further in that direction. For example, if the price of something is ₹1 was stuck when he broke 100 and reached 105 It is done only when you achieve it or achieve 110%. Now he can run even further and reach 120 km. Achieve it, okay, in the same way if you focus on something Now a bad news has come, obviously from 100 Why would he have achieved 110 when some It must have been good, right, it must have been good, good News Good But Maybe He's Breaking Out When it happens, when there is a breakout, the MA goes up even further. Let's go as if some bad news has come It's bad news, something bad has happened. Its price may break 50 downwards and reaches 40 and when the bad things come up and bad things happen so then Can't tell when she went from 40 to 30. okay so to go he's 40 It can also go up to 30, so break out and Trading on a breakdown basis is What happens is that when a breakout occurs, when a ₹1 If he has broken the level then people will believe that that now he will run higher because this This is a good sign because he has done something new. For example, if someone has achieved something Bronze achieves as if from a let One of our guys went to the Olympics. Believe that the East has gone to the Olympics. This year he scored bronze, next year he If you did silver then what will you believe now that next You believe that gold can do this, right? Psychology has come to people's minds. It goes the same way as when Purab struck bronze. So now that was 100 bronze, his bronze He achieved now he has 110 silver medals So what are people expecting now? 120 should go away friend, now Gold will kill this Same as when Purva's performance Earlier he was on gold, first year he won gold Mara in the second year, he struck silver in the third Sal struck bronze, now people believe Maybe nothing will kill me this time. Because his performance is gradually deteriorating. If it's happening, it's getting worse when it falls when he breaks 50 And if you achieve 40, people believe even more. can go down so that and cell cell cell and when it breaks out, it Bye bye and like I said I explained to you what happens when I say goodbye. If the demand increases, then the demand increases What happens if the price increases, simply People buy because when there is a breakout of expectation then after buying Demand increases and as demand increases Price increases as soon as it breaks down It happens, BD happens, sorry, BD happens breakdown then what do people do they sell Because of their expectation that brother now So it's going to break because it's coming down so low. Gaya right when something keeps falling People think it will fall further and further. And it will fall like Purab Gold hit Silver I hit bronze, this time I didn't get dull anymore. People think that now the East has gone. When the East went, people would think that Sellers grow when they sell and sell When the watermelon sellers had increased What happened, the price fell further? If the price starts falling further, then trading with Breakouts and breakdowns this way Works when breakouts occur People say bye and because of that and above When there's a breakdown, people sell Because of this the market goes down further. Okay, let's read it in more detail now. can definitely definitely read Yes, but I am thinking in this video If we read into more detail, You are too difficult for people I will go but I will still get my work done. You guys go to the chart once and that's it teaching things okay now look what's here It's simple, let's assume we can draw. taking Wait a minute, yes, see what the support level was. Look at the support level once, we support you. Level Dr will do something about it Right around here was our support level. Correct, this became our resistance. level this has become our resistance level okay The one below is done Support is done Resistance: Now look at the market which is stuck. had happened Around 1600 16670 K Around 1600 to 1670, he He was stuck now when he broke 1670 Look here in 1680 when he achieved One second after he achieved 1680 Look at the huge bull run the market has taken This is the market, first look at it, like this, like this, like this He was moving like this everywhere, like this After seeing him, he ran away immediately, nothing like that. It's not like that, it's straight up, so why did this happen? Because he has given a breakout here There was a resistance here which He broke 1670 now When the price broke, it made a new high. what people believe is a good thing when If something good happens, people believe it. Bronze is here, now silver is here, now gold is here I want gold to come now, I expect it to come that way. Tension increased among the people, people said bye bye Did the demand increase? Due to increase in demand, demand increased. Wait increased, demand increased and as demand increased The price has also increased, hope you understood. Hope you guys understood, okay? Explained as breakout, same break Down works if it's on the bottom If I had broken it, I would have run downwards, okay? Hope you have understood how to trade on this basis. If I explain how to do all these things If you want, there will be a dedicated full form on that too. I will bring it, okay, let's go to the next one. our okay my screen over topic My face is back in front of you all. There will be hope fully, after this there is understanding. Look, we have a lot of candlesticks now. We understood things, we looked at the charts. I've seen so many different charts now. It's time to look at the candlesticks because Look what's in the end inside the charts no what is this what is this all this Everything is a candlestick, so first the candle Sticks are better than candles If we talk about sticks, look at this candle. There's a concept in a stick OAC: It is important to understand this first. Means Open h means High L Means Low Sea Means Look closely, now I will explain it directly, a green When are candles made, what did I tell you guys? had told When the price goes up, the candle is green. If it is made then obviously it must have been here for Example: Price 80 and here it would have gone up to 90. Only then this green candle was formed, right? Now what happens is sometimes it's like 1 hour If the candle is of 1 hour, if the candle is of So sometimes it also happens that the market does not Instead of 90, 95 also went, 95 also went but He did not stop there, he returned as if a When the hour is completed, it is believed that this candle is 2 From M to 3M, although some in AM Trading does not happen but they believe so. This is a candle from 10:00 to 3:00. As if it was 2 o'clock here and 3 o'clock here Were doing okay at 3:00 he was on Exact 90 It has come and closed and at 2 o'clock it started at 80 It happened but it was around 2:30 on 2:30 She even went up to 95 but back when : time na so If it stops at 90, then the value of one candle The highest point is the highest point What is it, 95 is what we call high It has an open point which opened at 2 o'clock Whatever was opened on 2nd March, we will open it. Point says We will close the open which was closed on 3A. Point says okay now you will say one And so the point is here, take it and do it, okay. If the market had gone below 80 and between I think at 215 or anywhere else, anyone At a time between 2 and 3 o'clock At some point, it would have gone below 80. He would have become our low, but if below 80 If it doesn't go then 80 will be our limit, okay? Now let's look at it without price. Now we look at the candle directly on a chart. I will draw it and show you, okay now again the same Thing we have to do is understand oh lc okay Now we will not write time-wise, now we will directly write a We will see the candle, this is our candle. That means the wicks are up and down. The first thing I would tell you is Okay, this is the middle portion. it's called the body the body okay this is what There is a colored portion, it is called body and in these The points are called wicks or shadows. The shadow or shadow is formed when The market or candle started and closed if it was above or below that If the candle has gone in the middle then it means as if I I had told you that 80 to 90 candles had gone but that If it went up to 95 in the middle, then one week above Or a shadow will be formed and if it is below 75 Or if it went up to ₹ then there was a shadow or wick below also will become And this is the middle portion of our body. Okay, I'm going to erase it all now. things and now you guys have to open high close I have to tell you all these things, okay this is Question Number five okay now in this I will give you simple I am giving it to you, okay, it is a simple one. The open will always be a green candle open below the right Why will the open be below 80? So it will remain low, if the price increases then it will be 90 Right, so let's say 0 went here and up there, that middle I had gone but when I returned to the market, When the candle closes, come back and stop at 90. If it goes then 100 becomes ours, hi Points are fine if they're below 80. It would have gone, okay, it would have gone below 80, as if By 0, 70 would have become ours, now whatever Question number five will be there for you. I want to tell you if neither in this nor above If it is neither high nor low then its open So I wrote it to you guys and gave it to you guys. Done 80 closed 90 Okay, this is closed, this is open now. tell me what will be its high and low And look what will happen, this question number three It's five, okay, everyone has to answer. Three One High and Low what will happen if There is no line above or below it, which means 90 is our high It will be made and 80 will be our maximum because There is no point below this which is the highest The point below is what we will call it. The topmost point is called high. This is what happened to the green candle and the red candle. The exact opposite scenario will be red Candle opens higher Red candle opens higher It happens because it will start from 90 The open will be higher and the close will be lower when If it falls on the If this will cause him to go down, then our take will become that If it had gone to 0, then our Look, it could have been made but I admit it did not reach 0. So what does this mean, our take will remain 80 only. Our low will remain the same if it is anything above 90. If he had gone, he would have been our high but he believes If it doesn't go above 90, then 90 is our high. Okay, so the green candle will open down and The close will be up, okay? Open close and red candle open will be above The close will be below, okay, we have all these things. Explained and learned about candlesticks Look, this simply tells you that Look how powerful the candle is. As much as a candle takes a big movement For example, suppose there is a candle which 80 to 82 movements have been taken in an hour in 1 r. And so is a candle that made a range of 82 to 90. I have taken movement from 82 to 90, now tell me Which is stronger? Obviously second. Strong is right, so you will say that The market is running high right now, so you Candles indicate that a particular time Within compare to last hour market now What is running too fast? It seems as if it is falling down and has slowed down. Now after 90 you got to see that the next The next green candle is our 990 From 90 it went to 991, from 90 it went to 91, meaning first in an hour it went from 82 to 82 to 80 then It went from 82 to 90 in the second hour and It just went from 90 to 91 in an hour, now you What is visible is that the market went up but now it's stopped almost okay so this Candles tell you, now we are candles Breaking down candles based on their strength You can also have a candle party. Partitions will not be spoken in a way Candles can be categorized as I will tell you guys first The strongest candle that comes is Maru Buju Candle Stick is called Maru Buju Candle Stick Yes, please check the spelling a little, I am not I'm sure I get the spelling right, okay? If the candle is so big that no one No wick or very small wicks Well, by the text book definition If the wicks are not as per the calculation but there are small wicks Even then we will adjust it, okay? Inh Maru Boju Candle Bolte Hai M A R You Maybe Maru Boju Candles This indicates that if the green candle is lit So the market is very bullish. running higher and stronger and if A red candle appears, which means it is very bearish. This means that there are too many strings going down. these are the strongest candles okay Strung Text book definition on candles edge in this There shouldn't be any delay, but we are a little bit We will adjust with small wicks No problem, it's okay after that. Our second point which comes on the second candle Stick That Comes That Is Hammer Candle Stick This is how a hammer candlestick looks like Yes, it is a hammer brother, it is simple, it is a hammer, okay. It's a hammer, whether it's red or green Yes, it doesn't matter to us if one The market is falling and we are getting hit by a hammer. pattern one Thor's hammer okay Thor's Hammer Guess what Thor's hammer looks like This happens and this happens up there okay This is what happened, Thor's arm was broken from below. It became sticky, it became wooden from the bottom and on top I'm whatever that big is, okay, if the market It is falling down, it is in a downtrend. The market is falling down, falling down Falling down and making us watch the hammer It is available whether it is red or If it is green in colour then there is a possibility that The market started running back up, which means it is a It's a reversal pattern, okay, it's a reversal. pattern Okay, what do reversal patterns tell us? If the market is falling We get to see the hammer pattern whether it Whether it is green or red, it does not matter to us. Does it do any good if this candle comes to our attention? If it is available, it means the market can run up. This is our hammer The pattern is fine, although there are many sticks tomorrow. All the patterns are hammer pattern done The Hanging Man Pattern Becomes a Shooting Star These are hundreds of patterns that I All about your candlestick patterns course I have been taught inside but in this course I As many as one candlestick this is our Price action trading course is included. I don't want you to have candlestick patterns I will teach you because if you like candlesticks If I want to read the pattern then I have done a complete I have created a course whose i button or Then you will find the link in the description. I will go and check the description, there will be more It will be easy, you will get one in the description You will get the link for Candle Stick Patterns Course By name but my work is still for you The most important things are price action. Tell me about the related matter, then I killed you, old man. I told you about candles, then I told you about hammer patterns. The one hota hai hanging man hanging man is Same same to same our ditto hammer okay Ditto Hammer is fine even if it's green Even if it's red, it doesn't matter to us. I just remember what happened last time. What happened, the market was falling down earlier? tha ok and if we get hammered when we fall down If it is seen then it is called a hammer and it Tells us that the market may go up This time it's the exact opposite. What is it that the market is not going up first going up and then we saw a Hammer pattern named it Hanging Man Well, nothing called the Hanging Man. You guys just call it Diya Hammer, it's fine simply If the market is going up and the hammer is visible This could mean the market is down. As we mentioned, this reversal pattern so when it looks like it might be The market should reverse before the market goes up I was going, whether it was red or green, It doesn't matter if the color doesn't matter If we see this, it means there is a chance that The market may fall, so be it. Our Hanging Man pattern is also complete. I'm doing it immediately so that Sorry, it may take a lot of time, please note it down once. Everyone please note immediately our first Done Maru Bhuju which we have made in green and red Both covered two he became then his After that, the hammer pattern is formed followed by hanging The main pattern is done, after that there are many more as the inverted hammer pattern occurs Okay, now put the exact hammer upside down. Put the hammer upside down What happens in the hammer The body is like this above and weak below instead put it upside down this time this time What will happen is that there will be such wood on top and below This will remain, this is what has become of us, inverted Hammer pattern also in inverted hammer pattern The market will fall first. falling down okay and if we have this If it looks like the market may go up, it's okay. The market can go up if The market is going up first, first up and then we see that whether it Be it green or red, I will do one thing. I do this and turn it to green from the side. I make it red from one side, make it green from the other. I'll let you know, brother. It doesn't matter whether it is red or green, if we If you get an inverted hammer, it is a reversal. The pattern indicates a reversal from here. may come Guaranteed it won't come, guaranteed it won't come, but it will come Now you can see when the market falls down Later we see the inverted hammer and The market later moves up, we call it called an inverted hammer Look, the name doesn't mean anything, friend. Remember this is a reversal pattern, if you go up If it appears to be falling, it means it may fall down. If you see it going down, it means the market is going up. It could be okay, it's a simple market reversal. It was going up, it might be showing down The market may fall, it may be coming down This was seen and after that the market went up Okay, now when the market is like this going up then later we see it so we give it some other name Shooting star okay Shooting Star is not necessarily named Hammer The pattern is the same, people just give it different names. I will give you an inverted hammer Hammer used to teach but what about you guys? If you ever hear the name Shooting Star Then you will think, oh, we have already learned this. No, that's why I'm teaching you, let's do it. There are many more spinning top indices as well. candles i just got you in a flash I'll give it a go, okay now it's time The weakest candles, okay the weakest What did we talk about candles earlier, Maru? Bhuju candle which is the strongest Next comes those whose body is like this And the time is so long, okay, these are called Doji candles Or they can be called induction candles. Candles are called indecisive meanings. If there is no single decision to be made then what is the point in this? It's like here was 80 here was 81 was here 0 was here 0 There are such large movements up and down But the body is just so small, okay? There you have it, our green doji candle! Green Indication Candle Indication Meaning You have no idea what you look like What exactly is going to happen in the market? This is a very weak candle if the market If the green candle looks like this then we know It happens that the market will run further but this is what it is. No, this is a very weak candle, weak means He is not from WICK, he is from WEA. K week is a weak candle okay weak candle We have no confirmation on its appearance. can you tell whether the market will go up further or The market will go down further, so it Red is what we call an induction candle. The candle is also the same, the red candle is also exact. It will remain small and the body will remain like this Suppose there is ₹10 above, it will become 79 here. And the wicks will be as big as the top and bottom. There will be such big wicks up and down in it. You are also not sure whether the market is Will it go up or down from here, some noise No, hence this is also called induction candle. It is said that this is a very weak candle. Let me tell you guys about candles. I have explained all the basic things, if completely Learn all the candlestick patterns. Which I was telling you, if you Whether to trade on price action You want to trade at the support level What do you want to look at at the support level? You see a hammer pattern like I said it comes like this, if the hammer looks We can see the market going up from here. Right, we know there's a support level. It's okay here, it also has a support level. There is also a hammer pattern on top of it, then there The chances of winning the trade have increased, right? Chances increased because firstly there was support There is a level as well and there is a hammer pattern on top of it. If you want to learn candlestick patterns On whose basis what will happen to you another Confirmation will increase and support level will also be available. You will also get candlestick patterns Candlestick will also show resistance levels. You will also get your pattern. Chances of success will increase significantly If you want to learn that then everything is in the description I have given the links but you have to do all that in this video. Okay, after this video is complete. After we have read all the candles, now we The next point you want to read is that, now look. The first thing I just told you Those with single candlesticks say it's okay. As I mentioned about single candlestick The hammer has become like an inverted hammer Shooting star, this or that, whatever Then after that I gave you another one. Button as Doji told okay now its There are no double candlestick patterns other than Like the one in which there will be two candles like I told you inside the bar then, remember? At the beginning At the beginning of the video that if the second candle is inside the first candle If it remains then it is called inside bar okay There are many multiples like this now. There are candlestick patterns in which There will be three candles, some will have two candles. Some will have three, some will have four. It will remain like this but we still have to learn all that. You don't need all that candlestick Price will be available in the pattern course I taught him what was necessary for action. okay because you need to understand the candle Was good for price action The next topic is what comes up. Volume is okay, next topic comes up. That is What does volume mean? It's very This is a very important topic if we talk about In the case of price action, Volume means how much number of Shares or number of trades in the market I am doing it, okay, how many trades are there? I'm going to give you an example, okay? How many trades are taking place is one I give you an example as if you are you, okay Let's name you A and Purva B is ok east B is to A east of the company It is okay to buy 100 shares of Purab Company I want you guys to buy 100% of the money. Who are you guys, viewers? Viewers, my writing is so bad, man. What a bad writing I have, okay, no problem. Viewers are what they are and Purab is what they are It's gone, it's done B Mano Purab Company If A wants to buy 100 shares of and Purab wants to Purva sold it as if she had sold 100 shares. If given, what will be the volume here This will be question number six here. What will be the volume, meaning of volume This is the total number of shares bought and sold. how many shares or how many of whatever Let's talk to Let's for example one I'm making myself a little smaller in a minute If shares are there, then shares are vegetables. If it is a vegetable, then how much is the total purchase price of the vegetable and Selling has happened, this is what we call volume now. If someone answers question number six If he has given 200 then you are wrong whatever the answer is That's 100 actually what happened Purab a Meaning Purab sold 100 shares to the viewer. Sell the actual deal to the viewers If that happens then it is only for 100 shares, right? Any number of shares in a market Trades are made as many times as shares are traded If I pick up this powder from someone When given to Then picked it up again and gave it to someone else. Two powders are gone, this is the third one, okay, like this. If you buy anything and sell it to anyone Diya that is volume any number of times Yes, it's called volume. I hope you understand. It will not be too long, it will not be too much Don't complicate things, note everything down first. Do it, I will erase it after that. I'm a little tired, okay, so I I still have energy, I guess it's been two hours. OK, start the lecture. Two hours have passed since the lecture started but then Brother, I will also study with your energy. Not just anyone, everyone read with the same energy. took note, everyone took note I'm erasing it now, okay, now we I will first learn about volume. Let me explain to you the volume and price. Of The relationship between volume and price is good. I will explain the relation to you. Look, listen carefully now. What can we do, we have three such columns We will make one, we made two and this is the third one column is done okay this is our This is our price Volume This is our Expectation ok what am I doing now I'll tell you what happens if How Volume and Expectation React So whatever it is, okay, let's accept it. If the price is increasing, the price should increase. It is okay with the price increase if The volume also increases. What did we say number, what does volume mean? Done, let me erase this in a minute and do some I draw well, okay What does volume mean? How many? Shares are being traded okay if first As if in the past hour Assume 5000 shares are traded at 5 shares and even though the price was 50 earlier Now the price has reached 55, still this hour 10000 shares have been traded, which means buy And as sales have taken place, the price has also increased and The volume has also increased in such scenarios. The expectation is that the market will go up. You can buy in the market. Okay, the market is expected to go up. Okay, now if the price goes down Okay, let's do one thing, bring down the price. Not that one, now let us give a little different example. Let's take the second scenario, the price is up If the volume goes down, it means the price Earlier it was 50 for 50 when there were 5000 shares 5 shares were being traded Now when I turned 55, I got only Rs 1000. What does it mean that shares were traded? This means that now the people who buy and sell Earlier I was buying and selling Rs 5000, now only Rs 1000 buying or selling whichever Okay, that means it's in the market right now. be cautious I have to stay safe, the market may fall, okay? The market may fall, okay, one thing. We write down then cautions I write so that you people know more I understood it clearly, okay, it went down like this. Chances of market fall in this scenario and stay here Now let's take the next scenario where Price is falling and the volume is increasing now this is not much It will remain complicated for you people. Let me explain, see what we talked about volume The volume does not mean that How many? How many shares are being sold or bought Volume means how many shares The transaction is taking place, meaning the selling party There's also a buying party, now there's a thing. Understand when the price is falling Price is falling and volume is rising Okay, the volume is turning up, edge in the first 50. 5000 shares were traded then, now As if 10000 shares trade for ₹ became ₹ Now tell me what you guys will feel here But the volume has increased, meaning people are buying. Those who buy rights have increased. Now the price should go up but you Thinking volume means buying? The volume means how many shares Transaction was done which means 10000 people Sold and 10000 people bought it means What happened, earlier only 5000 people were selling There were 10,000 sellers, now the first 50 have become sellers. 000 people were selling at a price of 5000 People were selling, now 10,000 people are selling. What does this mean if the price falls? And the number of sellers has also increased. 5000 people were selling, now 10,000 people are selling. This means the price will be even higher Below It will fall, understood, if the price falls and The volume increases, understand this very carefully. Understand the thing now, I will explain it later on the chart. I will give it, okay, this is a simple concept. This is the only difficulty, nothing else is above It was easy right when you volume I was growing up, there was no difficulty in it. that's very easy okay after that when When the volume falls, the price falls. If it is difficult then the price falls when 5000 shares if traded when the price was ₹ If the volume was this much then it would be fine Meaning 5000 people are sellers of five There were five buyers Correct, what happened now when the price is 40? went so it went from 5000 to 10000 now here Understand one thing, this volume has increased by 10,000. But here it also means that first The 5000 sellers that were there are now 10000 sellers. The prices have fallen and on top of that, the sellers have also increased and when I explained that when the watermelon If the number of sellers increases, the price will increase further. falls okay now anyway if the price falls and the volume also falls volume Now it falls, understand now, now the price comes back is 50 okay before were 000 Sorry 5000 Sellers and Buyers 5000 Sellers and What happens to buyers now that the price has fallen? It's done now, isn't it? Buyers and Sellers of K One Volume What does volume one mean? That even though the price has fallen, the number of Sellers also fell, look, the first 5000 people There were 5000 sellers selling watermelons. There were 5000 sellers earlier, now there are 4000. Shops have become less, even though prices have fallen. 4000 shops have been reduced, what has happened now? The price may increase, okay, it may increase, but Definitely it is not that it will increase but It may increase because there are currently 4000 sellers. The number of people selling watermelons has reduced by 4000. If you went and did not understand, look back a little. You will understand, that's all it takes. This is a complicated thing, after this there is no It is not a complicated thing now. You will understand it by going to the actual chart. You will understand this only by going to the actual chart. If I explain it, it will be a little difficult and that's fine. Now I will remove all the indicators here. I am giving Okay, now we'll simply go to the indicators. and then click on Volume OK By the way, volume means total. How many shares were bought and sold throughout the day But that doesn't matter to us, it matters to us. that right now in an hour or for every single candle How many shares or how many trades are bought inside And there have been sales and this thing that is coming down Now look, let me show you guys first. hm pay attention to one thing There's nothing right now, look at this here. Not there. Correct one minute my eraser tool selected I was tapping the screen over and over again I thought what happened, what if not then here But look, there's nothing here now. I'm going to apply the volume tool here. Search I will go into technicalities and search. Is volume this volume we put this I am also putting a star on it and the volume As soon as I put it in, look, something came down. Been down it come Got this volume indicator now I use it I'll explain it to you guys later. Let me explain all the things like average etc. first. I will explain it ok Now let's do one thing Let's change it up a bit one day. Let's see, it will be a little better. seconds What does day one day mean now? Every one of these The candle that you can see right now is one Each candle represents a date. It is showing one day at a time, okay Each candle represents one day ADFC This is the bank which is visible below. The volume is what you can see below. Right now where I'm scrolling is fine. This is the volume now the volume, look how we Identification Now look here, okay, look here. Is happening Look here the price is increasing, okay? Prices are rising and volumes are also increasing. Let's open the first chart that I gave you guys. I had written it down and opened it immediately. When the price is rising and the volume is increasing So what did I tell you? The market is expected to go up And look, the market went up. Above My spelling is bad, please leave it. My writing is very bad, moreover I've been sitting for two or three hours, so I'm a little It has to happen like this, we have done one more thing I learned it, okay, now let's come to the next point. Now see when the price goes up It's easy, the price went up, the volume also went up. Meaning our expectations are also going up. Look back Price went up with her Volume was low here, look here. Volume has increased, which means buyers are increasing. This means that the expectations of buyers have increased. Meaning the demand has increased Meaning the demand has increased What happens is that demand increases the price. Correct When demand increases, the price When the supply increases, so does the price. Simple falls short when it comes to selling It is a bit difficult, now see. What we will do is draw that chart here. We'll do what we did with the chart. You need to create three columns, one or two and it's done. Expectation is the first, we write the last I will take that, what will be the expectation Our first priority will be the price which I will write p, v means volume, now look at one It is important to understand that volume It doesn't matter how many people have bought it. or how many people sold the volume This refers to how many trades took place. Trades or deals are made and a deal is struck. a buyer and seller for Both should be there, so look, understand one thing. When we talk about price increase then We will discuss buying when the price increases. how many people are interested in buying and When the price falls, okay, when the price falls So we will talk about sellers, understand this much Now look, the price has increased, the volume has increased, okay? After this see what happened here Price The volume here increased, it was so much earlier. After the volume increased, it meant buying. The number of people who have come has increased, meaning the number of buyers has increased. Demand increased and what happens when demand increases If you buy something, its price increases People with this have more interest in any When we talk about things, don't assume you are a shop. You go there as if it's a shoe store or Then imagine you're planning a wedding for your girlfriend. When you go to get your bag, you get the same bag. I like someone else's girlfriend He likes it and a couple of other girls too. If you like the same bag then the shopkeeper What would you call this bag if it was normally 300? When he sees that brother used to sell for five When the people want this bag, they will say 500. It works like this directly when the demand increases Then as the price increases The expectation will be that the market will go up further Now let's see the second thing, the price is high Okay, the price is a bit high here. Okay, look at the volume with this, the volume a little bit The bit has fallen, the volume has fallen, it has fallen like that I won't say anything, the volume hasn't even been increased. If it had fallen here, perhaps the market and Butt falling down because the volume here If it is the same then see the price is also the same. The price did not go up if this volume If it had increased, it would have given bigger candles. The market may go up from here but Volume has fallen, price has risen, this means The market may go down or the place may Keep it up, okay, understand this thing, let's go to the price It happened when the price increased Volume increases, meaning demand increases. And the expectation is that the price will go up. It happens that the price has increased, okay, the price has increased. The volume did not increase The volume did not increase Here's what the volume looks like when it doesn't increase. So after this the expectation will be that the price It will probably go down because now the purse For example, as soon as 00 is The shopkeeper said it was a purse and it cost Rs 500. If all the people were as many as those girls Those who liked the purse, they can go directly to the shop If he leaves, he also gets his value back. You will get it for Rs 300, right, if you buy it. The demand for the same fell as it was at six The girls wanted to buy those six Now I have become zero, so go straight back to him It will have to come to 300 or if it becomes one from six So he will have to come back to 300, this is what happened. Okay now in the scenario of price increase We will discuss the scenario of price fall. Before that, I erase a little from this side. I will do it, whoever wants to note it down, do it. Also note the example of the one with the bag. The example is good, you will remember it. ok guys now let's get after this Okay, so here it is, about the price drop. Look, the price has fallen, okay, the price has fallen. Look how big the volume is with him First look here, the price was normal. The volume was normal, it is a completely normal volume. After that the volume suddenly increases five times or Then it increased 10 times, which means the market As I said, when the price falls If we talk about, we will talk about sellers that's how many people are still selling okay Because the price in the market falls Why is it when sellers grow or people Sellers increase and the market Prices rise when demand increases Okay, so here the price drops and Look here, the volume has increased, meaning sellers grew and what we learned Sellers mean supply and the more the supply increases The price will fall further due to this the market look further down down down down When I went here, the price fell and the volume increased. Increased volume means increased sellers Suppliers have increased, okay, supply has increased. This means the price will fall and the supply will fall. Always remember that volume increases the price. Talking about demand in the scenario of And when it comes to price fall, supply What we are talking about doesn't mean that much anyway It happens but I will tell you to explain I'm staying okay now after that the price here But look, the price has dropped here. The volume is absolutely normal, there is no difference in the volume. There is no change in the price, but the price has fallen. There was no change in volume due to The market went back up, so here Watch the price drop and volume If it remains the same or the volume also falls The price will move back up on volume Here we are talking about supply. Sellers do not increase, supply does not increase The price did not fall, it went up here. But look, the price went up again. Understand this carefully, the price has fallen in the market. But look, the volume is the same, the volume There was no change in this, due to which the market and would not fall if the volume was increased What would it mean if it increased like this, sellers would increase further and then the price would increase even more It falls down, it's a bit confusing It is a topic but once you understand it then you Using volume so effectively You can incorporate it into your trading strategy So good he'll improve your game I'll try one more little Example for you guys so that you can understand completely Come on, okay, I'll do it right away. Okay, look here, the price increased, the volume increased. The market rose and went up, then after that Look, the price increased but the volume did not increase. Because of this the market got stuck at the same place. After the price increased, the volume increased and the market burst It went up, look at the price here. The volume increased only once, see why Here the volume is large in a single candle if If there were bigger candles, this Price goes up but volume here There hasn't been much change, so the market I came here and stopped, I did not go much higher. Hope you understand it better now. Don't pull it after that a little bit you guys a Take a minute break and study this chart carefully. Look at it and understand it well, then you All volume related points are over okay the price will go up then after that Volume up our expectation too then The market will remain fine and will go up Price up, demand down, we will The market will go down and then the price Supply down, volume up means supply up What happens to the price when the supply increases? falls down and then the final price fell down and the supply also fell meaning When the number of sellers decreases in a society He was going to sell 100 watermelons, now instead of that If there is only one then this one is ours The watermelon which was 80 rupees will now be sold as per your wish. This one will sell for ₹1, this one will sell for ₹120, similarly The price will increase here too because Suppliers have reduced, I hope you understand. Now I won't drag this out for long. I told you about price divergence. We call price divergence very This is an advanced concept, I have given it to you guys. I have explained it now, now you should also look at this. You can use it as an indicator like for Example, what can you do to A support level has appeared, okay? You see a support level here. I am giving it as an example, just so you understand. It's not so easy to take a little later But I'm just telling you, okay, here you are. A support level has appeared, okay, and you What do you see? There's a hammer pattern here. As if I went with him here again You could see that the meaning of candles was this The volume is also increased, so what do you see here There is support and on top of that there is volume too. Growing up when you know the price It is increasing at support as well as volume. growing, you would know that The market is about to run away and you are going to buy again. You could have made a good profit by doing this, okay? by end You must have understood profit hopefully. Price must have understood this technique as well. The volume to use is one off The Most Important Tools in Price Action The most important tools for understanding This is one of them. Okay, I hope you understand. If we talk about the next point, then we Discuss false breakouts Let me erase all this. Okay, I've erased all of that. And then we have to talk about false. We have discussed breakouts in detail. okay we've talked about Already understood breakouts, breakouts happen Now let me explain what false breakouts are. what happens so that you guys get even more Sometimes we can come to better understanding I'll draw with you and tell you okay So this is one let's say the price is here But 80 The price went up, went up, and it was like forever Price is stuck at 00 ok price The price went up and took a slight break. given out okay it was 100 here Gave break out as if you thought till 103 The breakout is now great. The market will run away as soon as a red candle appears. The market is down The market is down came down you said bye here and You have suffered a loss, now why is this happening? Look, this happened because there's a False breakout now seen, many reasons behind it There may be a reason that your placement of the resistance level was Maybe the placement was not correct or You may have created a line of resistance. instead of a zone okay you have to create a zone You need a line as I told you. There should not be a zone. That there is such a person, brother, so there is a zone It could have been, or it could have been, that the market The market has cheated you. What has the market done to you? It showed that the market would change from here. It is going to happen but the market did not turn out that way. The market has shown a breakout here. I am going to give it to you but I am trapping you here. taken okay the market came down and You have lost, okay, they say Are false breakouts a mild pain? give hope that hey breakout is coming and Instead of a breakout, the market reversed down. Let's call it false or fake. Breakouts are okay Falls or Fake breakout is okay, there are many ways to avoid it. There are ways but right now I am going to tell you the best way for beginners. I will tell you the best way, the simplest way. I will tell you that this is to be patient, patient means You don't have to become a hospital patient. This means you have to be patient now. I have to be patient, I showed you how here. Not that it gave you a little breakout. And you have to wait here, it has reached 103. What do you want to wait, one candle or two? The candle at least closes above that resistance It means you wait for one or two more candles What will you do if you get 130 Maybe he was going to meet me at 03 to say goodbye. You may have to buy but now you are on a false breakout. We were saved from the danger which would have caused a lot if it had come down. You would have suffered a great loss now. Only after confirmation of breakout is received You took my trade this way The best method is to false breakout Identification Where will the former get the profit from when If there is profit, where will it come from? Any XY root ram Shyam or some Radha, not Radha name Anything will go wrong, I'm a little bit I was taking random names but my God was in it. Let's assume that the names of When any person suffers any loss due to XY If it happens then it will go to the east from Loss itself. Profit is earned because in the market Money is not going to grow on its own, is it? What happens is that when those who have Now watch what happens as I I explained to you how the market works. Demand and demand based on supply and demand Supply means if there is enough demand It should be created if for example like that we said that when the whole colony was a watermelon If someone comes to buy from someone else, the price will increase. If only five people came instead of him Five people on five people, say 10,000 If you ask for watermelons, if you ask for 10,000 watermelons The demand has been created throughout the colony. Only these five people fulfilled the demand. Similarly, such people did it in the market too. There are those who have so much power that That entire colony means all the traders There is more power than all the traders combined. No more than they have There is money So that they can create demand if If all the traders together have 1 lakh shares could have bought 1 lakh If they could buy shares, they have the power. that it may buy even 10 lakh shares or one Even if you buy crores of shares, this is what happens We are institutional investors I, you and I are the people who are trading We are called Traders Retail Traders, okay, we have become retail. Traders who have people or agencies Institution or Organizations have assets worth thousands of crores There is money, there is money in billions which Now obviously those who have money in billions They will have people who have the right methods. Let me give you an example, that is LIC is ok LIC Life Insurance Corporation Tum People already know that this is India's biggest The biggest DII is DII Domestic Institutional investor means Institutional investors who are Do you invest in or in the market? They trade with more than Rs 500 crore. It's okay to have more capital 500 crores tell me if we watch this video If all the people who are watching If you add all your money, Can we even compare to them? Now these people can do what they are, if If you want to achieve profit then you can earn up to Rs 1 lakh. Shares As soon as the market came here, this 1 lakh shares or 10 lakh Selling shares and selling off the market okay you wanted the market goes up okay let's say we Here's what traders did: 03 Aaya Hai 03 Pay Traders Ne Retail Traders Let's place buy orders, hey friend brother running 103 arrived 105 will go 110 120 will go and we will make good profit Retail traders have sold how many shares Orders must have been placed for 1 lakh shares of Mill Mill 10 lakh shares right or 10 lakh at a time You can place an order for shares so that These sell orders are placed if the market goes down. What if I invest 10 lakh shares? The market will not go down due to these institutions who have billions of rupees and They have smart people. The team has inside information about the market We call them smart money. Well, their name is Institutional. Investors are fine, institutional. investors because they have a lot All data It is a very big team and obviously when there are billions If you are investing money then there is some reason or the other They will install it only because of this, so they have no reason. The solid ones are right next to them, inside There is information that we don't know They know what's going on inside that company. If you are buying shares of Purab Company, it is happening If so, we have the A to Z of Purva Company. I don't know, we can do as much research as we can. They will do as much as they can to get even a single straw. There is an investigation into who is working there. Who is probably sweeping and mopping there? They should also know that these people are like this. Smart Money, who has a lot of money and it You can manipulate the market to your liking Fake breakouts also occur due to these reasons Whereas these people mean your smart money. They will make you hit stop loss and their I will book profit, I hope you get it It would not have been too complicated What's the best way to fake a breakout? The market for survival went up, it went up to 103 Don't say bye, it is 100, if it is 103 then don't do it immediately. Say goodbye, wait for a couple of candles, one more. After the two candles close You can say bye as well if the below And here, as soon as he broke it, don't immediately Sell it, wait a little, give me one more If the candles come, sell at a small loss. It will be a small loss but a very big one. Loss can save you from a huge loss I'll tell you one more thing that can save you okay whenever breakouts happen okay Breakout: Who do we consider and who If you don't do it, I will explain that too. By forming such green candles in the market The candles are coming and it seems as if this candle has It is at 100 level, it was broken. Not out until this candle is complete and another candle formation above it. It doesn't mean someone is disconnected from here. No gap candles, look here. But there is a gap, isn't it? This is a candle with a gap. No one is complete and closed until Until then it is not considered a complete breakout. I will say that if you did not understand then I will explain it again. Yes, this candle is lit, consider it lit. It started at 98 and ended at 102. As long as a candle starts at 102 It is not considered a breakout until it closes. We will accept it because the candle at 102 opens Maybe it may go to 95 because of this I have to wait for the candle, I have to wait for this candle What to do if you want to avoid false breakouts Okay, now we have done pull backs etc. We had already learned the reversal. So we have learned retracement. Now only two-three concepts are left, I am one After taking a short break, he continued again. I need to have some water and then I will be back soon, thank you so much for waiting. Till now and thank you so much for please friend Like, comment and subscribe to the channel Leave a comment and subscribe to the channel I've been working so hard I keep going I have been sitting here for two or three hours, I don't know. How much time has passed, I don't even have time I know when I started the video, how much I've covered that so far and there's more to come. If there are things left, wait a little. Have some patience and we will continue in a While Thank You You are okay and I am back, take some rest. It was good if I took it because I also got energy. I'm back and I'm able to tell you all Things came back to mind, what was left? What all has happened, what all has not happened, actually rest I just had a two-minute plan, but it Turns out I took a 30-40 minute rest. I took some tea and drank it because It's 8:00 in the morning I haven't slept all night because of you guys I'm here for a second to teach people I couldn't even rest, I slept the whole night without wasting any further time let's get Started Only a few points left Only a few Topics still left to be covered The rest of our course is complete. So let me first tell you that something Points that remain about our volume If it happened then they complete it first. Of course, there is one thing I need to tell you very much. is about volume and demand that if At the same price if lets say for Example one second Yes, at the same price as Let's, if many Just because there is more demand doesn't mean That the price will keep rising let me give you An example that if for example 00 Priced at Rs 1 lakh Shares, okay, buy even 1 lakh shares or else Just because there is demand, it does not mean that it The price will suddenly increase, okay? 1 lakh is not too much even if it comes to 10 lakh. If it goes then it is not so that its price increases immediately. It will increase a lot if With increasing prices, volume and If demand does not continue, it means price And it won't grow like I did with a watermelon It was told in the example that even if at 80 Ask for 1000 watermelons, okay if they cost 90 If 100 watermelons are not asked for then its Price cannot increase, this means price There should be demand even after the increase Okay, like if it's 85 and suddenly His demand dropped to 50 or 100 If it happens then from here the price will increase to 86 Thereafter the demand could not increase Because of this the price will not increase as it is late. I give you an Example If 00 But let's assume that the normal demand is 10,000 Around 10K but suddenly in demand It increased to 1 lakh, it increased to 1 lakh This does not mean that the price of 450 The price will go away or the price of 500 will go away The price is wrong, a little more than the first 400 It will increase to 410, for example, now it will increase to 410. But now it is important to know how much demand comes. Is there a demand for 410 as well? If not, If it comes then the price will not increase from here. It will do so even if we get Rs 1 lakh here. Instead of that if it was for Rs 1 lakh For example, if Rs 30,000 had come, the demand would have been Rs 30,000. It would have come at a price of 400, then at 406, as if And there would be a demand of Rs 30,000 and then after that We can see 40000 even on 410 demand is okay 30 30 60 60 and 40 1 lakh Right 410 also has a demand of 40 then Its price goes up to 415 or 420, okay? Just because even if it is worth Rs 1 crore for Rs 400 If demand comes, it is not that immediately Price will increase with increasing price As the price increases, so does the There should be demand even with rising prices If you want the price to rise, it means It is not that if for example one If you are an institutional investor, this chart For example, this price is 100 120 140 So it is not that they spent 120 Suddenly it was as if I bought 10 crore shares. So it will suddenly go for Rs 4000 or Rs 00. The price will go away, this is not how it works 120 It will go to 140 before, there will be buying at 140 also. There should be demand here too, then and the Fard will go up to 160 and the demand will be 160 If it remains then it will go to 180, that means with increasing Price demand should remain if demand A lot comes at just one price This does not mean that Price is running away. It will go away, okay, someone please note it down. I haven't noted it, so I did I have drawn such a thing that no one will understand anything But I will do one thing, clean this area a little. I draw it well because this was an important factor okay I'm a I will draw this one and tell you again. I will give it to you so that you can understand it better. So it should be understood and clear, okay? If the price is ₹1, 120 or 140, it is fine. It is 160 for example, it is not 120 But if a demand of Rs 1 crore comes, Rs 1 crore If there is demand for shares, then immediately It will cost Rs 300, not Rs 120. First 140 will go, there will be demand for 140 also. It should go from 140 to 160 and then to 160 also There must be demand if demand is increasing If demand falls along with the price The price will not increase like we did with watermelon. I saw in the example that earlier the demand was 120 As soon as it reached 140, people started saying No brother, we are not buying it now. He said that he is not buying it now when there But if demand falls, the price will fall. ok i hope this point is clear then After this we have very few points left. The first point we have left is that Retest I don't know you guys Have you heard the retest or not? breakouts happen and then After that, before our actual retest. Let's do one thing and cover those points. Support and resistance with no What happens when any support breaks If he does, it becomes resistance and If any resistance is broken then it It becomes support, what is he saying brother? The complete Let Me Explain Let's Say For Example: A chart with a price of 60 He's stuck in the middle of 100, okay. It's like he's spinning, spinning, spinning and so and so and he gave a break broke out okay now break out did it went up went this happened that happened now what It happens that this is the price of 00, which We had resistance before, now it is new. becomes a support brother why is this so how what if east The market will come back down from here. The market took support here and moved back up. Maybe why but why why look understand I'll go back two steps, okay, two steps. Let's go back a little bit and see what happens now. I went there but people did not know about the resistance. There were many people here placing sell orders. They were sitting and had to sell it to the people who sold it. I had applied, okay, those people failed. It failed because the market ran upwards. Gone is theirs now Loss is okay, just remember this thing, nothing else. no okay now some people here Got a breakout Those who got a breakout B He said goodbye, meaning Demand created Meaning The price has gone up a bit, correct now. People did not buy on breakout here This happened to those who did it correctly The breakout was monitored by people I had not kept an eye on the breakout, now they too It was seen that those who broke out I took the trade, brother, the price went up. Here he took the trade on the breakout now Price went here which people missed out People who did not get the trade No, now those people have become interested, okay now that People did not get the trade, they Also because fear of missing out This is what we call FOMO is visible to other people, friend. I am making profits in this trade. Why did you miss out on a trade? This is called Even those who said goodbye to FOMO I missed B He also missed the breakout. Buy demand created, price increased again grew up okay now what happened along with that People placed sell orders, okay, sell. Orders were placed at the resistance level But it's okay, those who lost it now There was a loss, now they have to recover the loss. They feel that when they are so above 100 If it has gone then when it comes back to 100 then If I buy it, I will buy it and this Once again, we can recover what we have lost. If you take it and earn profit then everything will be fine right now. People had taken on the first breakout Those who took the trade for the first time, it is okay Because when he gave us a breakout of 100 It looked as if he bought it at 03 book profit Okay, now he waits. As if it went up to 120, they made a profit He exited with profit. He did it and made a profit of ₹1. Now what happened, you made a profit of ₹1 Exited now that the sale is done. Meaning, whatever he had bought, he had sold it. I did it now because the sellers are increasing. The market will slowly come down. Will come down now see whose last time loss It happened that he was waiting, as soon as 100 I will buy it because it will last I lost time last time I sold it thinking it was resistance, now I am buying it. The market will bounce back from here. they're just thinking okay they thought And said goodbye to her here for the last time. Time who bought at 13 and sold at 120 They also booked profit when they sold it. They too are feeling the market now, friend. 100 has come into the range of 120, now back to 100 When it comes back, we will buy it back. will make a profit and those who bought late It was the last time, okay, what people said I did it for 103 but I didn't buy that little bit. He stayed patient and remained as if he I bought it last time at 115 and he I regret it a lot, I bought it for 115 I wish I had bought it at 102 or 100. There would have been a profit of ₹ what is happening now All three of these trees will be new and fresh. Entry will come ok Which fresh entries will come, who had previously sold on resistance and whose There was a loss because the breakout occurred. Okay, one who bought at 103 Those who took profit now and profit back and those who have done it too late He had taken entry and now this time he is on time. Earn big profits by taking entry want to make profit So as soon as the market is back to 100 Will you come around now? Enough of the mess, okay? Now I'm going to erase all this for a bit. If you want to note it down, do so because there are so many I don't know how to explain in Khichdi, okay I am erasing it, please take a screenshot brother. If you don't want to note it down then it's fine, I am erasing everything now so it is fresh. Entries will come around 00 and as soon as this Fresh entries will come around 00, see. What will the market be like from here? Wait a minute, let me just say something right away. I am erasing it so that I don't erase anything wrong. Let's go okay, no one, if the market is here had gone up above, after that as soon as If it comes around 100 then all these three parties Now she will enter back at 00, she has returned Who bought it first, as if one party He bought it, his demand came and he bought it. Placed orders, their demand came second Party Buy Orders The third party placed a demand and put a buy. Demand came and now there is another fourth party Those who did not trade last time who had taken it and had not sold it Those who said no saw it Dude, the breakout came at 00 and went till 120. I went this time, don't miss out on 00 okay this one is also a victim of fomo Fear of missing out, why did I I did not take the trade last time, it was at ₹1 Will buy back now there are four participants Those who are going to buy have gone because buying is happening. It means demand is increasing, so demand What does it mean if demand increases? The price increases and now the price is back to ₹1 She got up and went back upstairs. What happened now? Look, last time there was a breakout at 100. Took support at Rs 100 and now take it people We became confident that 100 is now ours. The support level has been formed because First a breakout, then a breakout After those who were interested first party, second party, third party and fourth Parties who did not take any trades He was a victim of FOMO and he also took the trade Demand came, profit came, market came back up It seems as if this time it went up to 110, then now people Who knows that when it comes back to 100 I want to buy it back because now is the last time What will happen? A fifth party will come fifth. Another party will come, another fifth party will come. When the bar comes back down, which party will it be? who still haven't taken the trade Who did not breakout even the first time who did not even try to do it the second time Now he will take it for the third time, so now more The number of participants increased and this led to a 00 Which is our support level now. I don't know how much you guys are in this mess whether you understand it or not because I make a lot of mess, but I hope Do you understand? Five parties will come now. And now because of this 00 has become our support level. It will go well anyway if there is any resistance Level breaks happen as we just saw The resistance level was broken and later The support level has been formed, okay, the support level Why make it, look it is simple first There was resistance, the market came, came, came. I braked, touched it, okay, previous The number of times people traded here Those who entered very late He had taken entry and he took entry back. Brother, you will make good profits this time. who sold here okay They also entered and those who traded did not take any trades did not take any trades When he also entered, there were four new ways People came who entered and the market Now it has gone up above the resistance of ₹1 earlier This used to be our price of 100 This used to be resistance, now it's support. It will be made because it already took a bounce Now when he comes back down, these four people will So we will remain and it will become plus one. Those who did not take the trade this time also Five people to take trades now Five people s in five different parties five parties A in those who did not take the trade Those who made profits All five who made less profit People will come back, support will be built again and 00 Now we have a support level, I understand. Similarly, its exact opposite happens. At the time of support level, even when the support level Breaks are okay Support level when let's say for example this This is a market, this is a market, this is a market It is as if the market is at a support level. Better let's do something on my face It's gotten very close to okay now this market This is something like this, this is the support level As soon as the market broke it After the market broke, what now This is our support level, okay support level This time it was the first support level, say 0 Let's assume the price is okay this is Support the exact same explanation As resistance became our support We had the same support after the breakup Resistance is created after it is broken. 60 point is now this will become a Resistance where same as Parties can participate again and this I hope you understand how it will make a profit I hope everything is clear exactly On the contrary, brother, as I completed it You gave me an explanation, it was exactly the opposite. ok this is clear i will erase it I give you what people haven't noticed yet I have done it, note it down immediately, this is the Exactly the opposite, anything is simple, absolutely It's simple, don't worry about anything, it's okay Now we will learn about breakouts and retests. After that we have to learn to trade on gaps If people don't know the gaps then I Before I explain the gaps, let me do one thing. Let me explain the gaps so that you can learn a little about The concept should be introduced first and then So let's go to the retest, okay my friend. I am getting charging issue while charging I had installed it and the charging became very slow. Come on, no one will give me this last time too Actually the video had to be stopped because Because the phone was not charging, it's fine. I just erased it, hopefully everyone noticed it. You must have done it, okay, now on to the next point. If we go, we are taking the next point. of gaps okay gaps or however we call it will say Price Caps ok good now see how good my writing is It's feeling good, you've got some energy, right? I needed tea, my friend. I needed tea. Because I have full energy, okay let's go So look what happens now, I've got you guys A green candle is a red one There is a candle, come let me draw it and show you It's a green candle, it's like it's on It started at 0 and closed at 30, then after that Now it is closed at ₹ as if it is one by one Let's turn on the hourglass candle one by one 10 AM to 11 AM, okay? It is a candle with 10 to 11. First The candle will then remain for 11 to 12 seconds Candle 12 to 1 will be the third candle 1 to 2 The fourth candle will remain, okay, I understand, now from here As if 20 became 30 from 30 As if this is our second candle that opened on the 30th. this This is one, okay, this is 35 pay close now. After this it closed again at 35, then the next The candle will obviously turn at 35p and it is as if Close at 40 This is our candle number three, this is 35 It started at Rs 40 and now it has closed at Rs 40. Look, this one is simple, it started at 20 and turned 30. But wherever it ends, it will be his. As soon as this one ended at 11 o'clock and At exactly 11 o'clock, a second candle went out. It will be fine, exactly as soon as 11 o'clock It will close and it will work for a few seconds. The candle will light up, then the third number When will the candle be lit when at 12:00 our The second candle will end at 12:00 seconds At what price did our candle end? 35 The next candle ended at the same price Ours started at 35, what happened now? The fourth candle is right at ₹ Our candle closed at 1 o'clock at ₹ This third candle closed at 1 o'clock. It's done, okay, it's going to close at 1 o'clock. The candle closed at ₹10 but the fourth number It is a candle of I don't know, it is from 50 It started from 50, it started here, so much A big gap has been created, look at this fourth Our number candle is from one to two o'clock The one that suddenly turned 50p was so big Gap created tell me when it's 1 o'clock 4 Pay price has closed, this is Purva Company Okay again Purab Company So the price of Purva Company closed at one o'clock. 0 and 1 o'clock, as if within a few seconds How he reached 50 is the price Gap Price gap means from one candle to another Creation of a gap between the candles Now always does not mean always but usually It happens that if it is a candle from ₹12 If yes, then the next candle will start from ₹1 only. Because this candle is candle number one and candle Number two takes just a few milliseconds. There is a difference sometimes but it happens like this Something so big can happen in milliseconds. goes So that a gap is created, what happened, the gap It has been created, now see how many times it has been found There is a difference of seconds, sometimes different There are reasons too, let me explain them a little. For now, I'm just going to give you the basics. I am explaining it like this, okay now price gaps There are some reasons behind this, that is first aggressive Buying and Selling if you tell me exactly this Suppose the candle ended at 1 o'clock and this candle Started exactly at 1 o'clock, just a few seconds like millisecond one second late okay one seconds late, as if this is just 1 second after a b If it closes at 1 o'clock, then within one second If there are a lot of orders at once, then Because of the region, I am not talking about my region right now. If I had accepted 1 crore orders Yes, if we get 1 crore orders The price will suddenly shoot up, right? A little aggressive buying within seconds or This also happens because of selling, now see many This is not a game of seconds, I I told you like that just for explanation. But sometimes this aggressive buying and selling It's not a matter of seconds, it happens like this Just before the closing of a candle Orders are implemented but those orders It takes time to get close, that's all you Don't think technology is none of your business. You have to understand why gaps occur first. Reason is aggressive if buying is done or else If there is aggressive selling then there will be gaps. If aggressive selling happens then A gap will be created downwards, meaning it will be red. A downward gap is created in the candle Look, this gap has been created. and if aggressive buying happens then it A gap will be created on the buying side, okay now. Apart from this, there are other reasons due to which Gaps are created so far note down If you haven't done it, please note it down. If you haven't understood the price gap, I'll give you a Let me explain a little bit more, okay? I will explain it line by line, it will be better, okay line I will explain it to you guys through a chart. It will be easy that way okay to understand like this is a chart that right now It was the 80's, okay, it went up and down, up and down. It's gone here, it's 0, it just disappears. It started from this and this started from this, so this is in between A gap has been created, this is the gap Called as Price Gap: Although there is no gap in the line chart But to explain it to you, I will show you a line chart. I'm explaining, okay, look at this, this middle. The gossip that is coming to me is called Price gap and this comes region number one aggressive I am writing Buying and Selling B&S You guys can write the rest, it would have been a second. Any news is because of its news impact. Brother, some news has come, think about the market. It was as if something was going away, something was going away very low and wait a little bit elsewhere I draw a candle on our second chart. coming in the middle of okay as if this chart I was going up, I came down a little bit I came down a little and suddenly the news came that Very bad news has come about a company. As if it was a scam worth thousands of crores gone or as if whatever happened is okay It's like the bank has been scammed. If such news of thousand crore rupees comes then The price of anything will not drop suddenly. Just like it was here from Let's to 80 100 went here, 90 came here and immediately From there it came down to 70, a gap was created in between. okay this is in the line chart I just am explaining for the sake of explanation whatever You have gaps in the candlestick chart But candlesticks are visible in every If I make it, it will take a lot of time. Such gaps are created and these are called Price gaps and what we just saw was this Because of the news, if suddenly some news Has a scam of thousands of crores happened or If something happened, suddenly a big thing appeared inside him. A sharp fall or rise could be good news. If it comes, it will go up. If bad news comes, Obviously the price will go down because of this. Grape is created in the third phase of the market. Reason for the sessions This is especially true due to market sessions. Talking about the Indian market, Indian What are markets like I told you? Told people it's not open 247 If you want to trade in the stock market If you want to do it, it doesn't happen 24/7. There is only a short time to trade here. Like the market will open at 9:15 and at 3:30 If it is completely closed then from 915 330 is the market, what happens now, believe it today It's Monday, okay, the Monday market is closed. Now even after 3:30, people are not placing buying orders. They can keep it on if they feel it is okay. that this stock is going to rise this is going to happen It is like this and keep those buying orders. If you can, what happened next day? 915 The market will open on 9155, there will be demand till then It will be created either by demand or supply If supply is created then The market will open lower if demand If created, the market will open upwards Similarly, this is the gap between the sessions. No, this gap that we have is one second I change the color to fill this gap. has gone to the beach Yesterday was Monday in between market sessions in Today is Tuesday, whatever demand in between Or because of the supply created A price gap is also created if demand If created, the price gap will move upwards like this It will be created if the supply is created So all our price gaps downwards I understood it, I hope it is clear would have gone There is another reason why price gaps occur. Can be created to be actions, these two Gaya and the third one I wrote was about market sesh. Because of market Sessions and then Fourth Is Smart Who is the smart money because of the actions of money? Did you forget what I explained to you brother? Smart money is the people who have The capital is worth thousands of crores in billions Capital is these are institutional Investors who know about the market Smart people know things we don't know They probably know who among them does the sweeping and mopping. is investing in that company, in that company if When he is sweeping and mopping, he is in the boss's room. What am I hearing about all these things? They know, okay, they need every single thing in the company. Only after knowing the thing, he can trade there. If you do it, then if the smart money wants, then absolutely If you create a lot of demand from someone From the region, so up there A gap will be created if the supply If you create a lot, the market will go down. While falling, leaving a huge gap at the bottom. If it can open then smart money's actions Gaps can also be seen in the market due to this Now that smart money is buying the gaps. This will make it so that I can explain it to you slowly first. Note this much, okay note this, Jin People did not notice my 5 in this It is charging, friend, I hope I complete it. Lou his Well, there's not much left right now. We learned about gaps. I learned a little bit about I have to tell you about the retest now. I just want to say a little bit about gaps. I'll give a small revision and then I'm going to move on to retest, okay, I'm not I want my video to end midway. Or it may stop midway because charging If not, then hurry me up a bit. You will have to see now, we have just learned about the market. What kind of gaps are there in work, use white color so that This is a chart to make it easier to understand. This is the chart, it's going up all of a sudden. This gap was created in the middle of the candle. This is the gap that I am drawing in yellow. Let me make it a little easier to understand Let's go, this is what we drew in yellow color. There is a price gap here when this candle closes If this happens, it means the next candle will also be here. It should have started but there was no gap in between. Okay, this is a bullish gap created. Because it creates while going upwards It has become bullish gap and similarly gap if downward direction I would open it, we do one thing with Red. Dr. will make it easier to understand This red market is going down and You can see it here in the middle Yes, the gap was missed, so this is Bearish. Gap and we know four regions, the first region is Aggressive buying and selling is fine B and S then the second one is because of news news It will obviously happen on the news if suddenly If something comes, if something good comes, then move upwards A price gap will be created if the situation turns bad. A price gap may be created on the downside The third is because of the market session Because our market is not open all the time So when it closes, the demand in it End supply is created the next day when When the market opens, that demand will suddenly increase. If news of supply means impact will come This can create a gap up or gap down. If a gap is created in the market towards the upside If it happens then it is called a bullish gap or simply gap up in the words say okay and Below and if we get to create a gap Or if you see it, it is called gap down. Okay, understand this much for now, the rest will be on these. I will explain how to trade it up front. Know about market sessions ok And the last thing I told you was if you were smart Money, whether smart money, means institutional Investors are fine if they want to. can move the market so that the price Gaps are created, it's okay, note them down immediately. Price moves on to further topics in How to trade gaps is our guide There's still one more thing left for us to do. That is retest reading yet to happen I Price I have already told you about the gaps. I will tell you about the retest and then later How to trade price gaps I will tell you, okay, it's simple, the price How to trade gaps There will be a full video too, don't worry. There is no tension for you brother Brother, please teach me everything right now. I will tell you a little more about the gaps. It will go over your mind, first understand this much Understood about low gaps, take note Okay, done, okay, now we have to Option one is to directly use gaps. I can teach if I teach in a mess I want to, but I think it would be better if I go first. I teach retests, I remember only this much about the gaps. put okay what are gaps what are not I will do one thing if I want to. How to trade gaps up and go long I will bring the video separately as well but still I will brief you a little in this video also. I will give it, okay, just a little charging issue Like this and I might be a little bit of a I have to wait for two minutes, okay? Let's move on to the topic of a retest. What we learned from doing is that if any support If there is a break then that will be done later sorry just a Second, I said it a little wrong, I miss spoke what we learned earlier that if any If the resistance is broken then later Go and become a support, become the right support So that he can take support and go to the market. The market can go back up just like that. When a support is broken, it moves forward This creates resistance, which causes the market to The market moves down after hitting resistance Right, whenever there's a breakout ok whenever there is a break out As if this is a chart, it has its own resistance above This support below This support above This resistance Right market up down up down down some was doing and here he broke Well, the market did break out, but What did he do? Come back down. Now see if he moves a little. If we come back down then that is the new level. One can test it so right now that support can become Either it is a fake breakout or can go back down okay remember fake I learned something called breakout, if here okay if he takes support from here Tests this level Tests this level Testing means we test it retest says ok test again He now resists what he had before tries to build support okay Previous tries to build support Resistance, okay, that was resistance now. He will come down and test this level if If she gives support then this is a new support. It will be okay if he doesn't support it. So it's back to showing a fake breakout and it's just A false breakout will occur and the market will also He is still in trend, understand me. whether I understand it or not, it's okay I'm going to explain it again one more time. Correct It's like this resistance level is support. This is the level, the market was moving up and down. Up and down, up and down, gave a break out After the breakout, the market comes back down. It felt okay, it started coming back down now. When we started coming down, our first This was resistance, now it can become our support. It can become correct if it is supported If it goes up with support then it becomes support It will be fine and if it gives fake breakout If it comes back down then it is not support This support will be cancelled and now Our resistance will remain alive and if It takes support if it takes support If he takes it, it's a very good entry. For a trade it is called Retest Trading The strategy is fine, although the breakout end Retest will say because first breakout Breakout happens when it is not direct It comes down and becomes a support if this It takes even a little support to go up There is no need for even a little bit as soon as here Took support, we saw a couple of green candles After that we immediately took entry and it was great. You can book profit in the same way On the contrary, if the market moves in the downward direction Wait a second, first you guys take note of those People did not note it, note it immediately I would also explain with the example below. Okay, I noted it down, done, I'll move on. I'm growing up, if the same thing were happening the other way around Okay, reverse edge in market if support It used to brake as if it was the market He broke the support, he broke the support What happens after he breaks up? There are many possibilities, it could be that Dakkad Direct Break Out From Here He may test this level again which We supported him in creating resistance. Try it, but now that attempt fails. If it happens then we will not call it a breakout. We will consider it a false breakout or fake. Consider a breakout if this attempt fails It happens but if he tests this level takes resistance, meaning bumping it down It goes as if it had previously given a down breakout Then give a breakout and find the meaning of resistance went to the old support which was new Resistance can be formed if it Gave resistance and hit the chart from there If it goes down even a little bit, we are in for down. Can take trade Open trade for down can do this is called breakout end Retest Trading Strategy Just Give Me One minute I charge it and start the video again turn on
Pending
Support zones can be interpreted as demand zones because increased buying activity at these levels drives prices up, while resistance zones can be seen as supply zones due to selling pressure at these levels causing prices to fall.
Support and resistance areas that occur How this can also be labeled as demand and supply We can also call public support as demand public. Are and resistance We can also call it supply people. Why look like we talked about it when When demand increases, the price increases. When the market repeatedly hits 80 If it is coming then what are people doing at 80 They are saying goodbye, they know when it reaches 80 It is also coming, the market is going up He said buy here, meaning demand. created due to which the market went up So we can also call the support zone as demand zone. Similarly, when the market repeatedly moves above 120 But if it is falling down then what can people do? The sale is going on at exactly 120 We are paying tax, we are paying sales tax meaning Creating supply and supplying After we learned what the sellers increases when the number of watermelon sellers increases If you go, its price will fall. The price then falls from 80, so it increases Because there are many buyers from 120 It falls because there are too many sellers. Because of this selling point that is Resistance point buying point meaning Support point hopefully this is also clear must have gone okay
1 year ago
Pending
Support zones can be interpreted as demand zones because increased buying activity at these levels drives prices up, while resistance zones can be seen as supply zones due to selling pressure at these levels causing prices to fall.
Support and resistance areas that occur How this can also be labeled as demand and supply We can also call public support as demand public. Are and resistance We can also call it supply people. Why look like we talked about it when When demand increases, the price increases. When the market repeatedly hits 80 If it is coming then what are people doing at 80 They are saying goodbye, they know when it reaches 80 It is also coming, the market is going up He said buy here, meaning demand. created due to which the market went up So we can also call the support zone as demand zone. Similarly, when the market repeatedly moves above 120 But if it is falling down then what can people do? The sale is going on at exactly 120 We are paying tax, we are paying sales tax meaning Creating supply and supplying After we learned what the sellers increases when the number of watermelon sellers increases If you go, its price will fall. The price then falls from 80, so it increases Because there are many buyers from 120 It falls because there are too many sellers. Because of this selling point that is Resistance point buying point meaning Support point hopefully this is also clear must have gone okay
Pending
Support and resistance are not always single lines but are often 'zones' or ranges due to slight variations in price points. Traders should use tools like the rectangle tool to draw these zones for better analysis.
Support and resistance levels also in angle and such straight horizontal ones can also be Such straight lines can be horizontal It is said that this is called an angle, okay. It's simple, there's nothing much to it, just draw it. Make two notes, everyone, immediately. Make notes, okay, I have made notes. I am erasing Okay, I've erased everything, now we're Next we will study the next concept about SNR in SNR is Never A no just never just write we will okay Never Just a Line It is always a zone as I am writing all Things are not written like that, you have a zone and Range what would that mean that I just now Simplification ki tumko a single line It's okay, but what will happen to the market? There will never be a single line in it, meaning How about if there is support, okay? I draw and tell you more like that Simple will suit you guys. If you are looking at this then this There is so much zone from where the market repeatedly Taking support, agreeing to a number If this is a person between 80 and 82 years old then What are the support and resistance levels? Nor are they always made in public, ever. Not a single line is drawn for better And let's get the best results if you Because what happens is sometimes a little There will be a difference in points because There is no such thing as perfect, right? Brother, as we say, it seems as if you have no He asks, brother, how much will this thing cost? He says let's buy potatoes between ₹50 and ₹100. Those who are in the middle will come for the middle. It happens the same way if you look above. There's a zone like this up there as well. Because its point is different, its point is different Its point is different, its point is different Look, these two points are a little different. If it is different then there is a zone for this Support and resistance are always drawn in the zone You should use the Rectangle tool for this. You can use a lot of things for this You can use the tools I give you when If I go to the chart, I will explain it, similarly when such There will also be a chart, right? So, it is such a There will not be a single line, it will be like this usually There will be one zone, okay, this will be one person like this. Similarly, look above also, there will be such a zone In which margin of errors is your saving grace.
1 year ago
Pending
Support and resistance are not always single lines but are often 'zones' or ranges due to slight variations in price points. Traders should use tools like the rectangle tool to draw these zones for better analysis.
Support and resistance levels also in angle and such straight horizontal ones can also be Such straight lines can be horizontal It is said that this is called an angle, okay. It's simple, there's nothing much to it, just draw it. Make two notes, everyone, immediately. Make notes, okay, I have made notes. I am erasing Okay, I've erased everything, now we're Next we will study the next concept about SNR in SNR is Never A no just never just write we will okay Never Just a Line It is always a zone as I am writing all Things are not written like that, you have a zone and Range what would that mean that I just now Simplification ki tumko a single line It's okay, but what will happen to the market? There will never be a single line in it, meaning How about if there is support, okay? I draw and tell you more like that Simple will suit you guys. If you are looking at this then this There is so much zone from where the market repeatedly Taking support, agreeing to a number If this is a person between 80 and 82 years old then What are the support and resistance levels? Nor are they always made in public, ever. Not a single line is drawn for better And let's get the best results if you Because what happens is sometimes a little There will be a difference in points because There is no such thing as perfect, right? Brother, as we say, it seems as if you have no He asks, brother, how much will this thing cost? He says let's buy potatoes between ₹50 and ₹100. Those who are in the middle will come for the middle. It happens the same way if you look above. There's a zone like this up there as well. Because its point is different, its point is different Its point is different, its point is different Look, these two points are a little different. If it is different then there is a zone for this Support and resistance are always drawn in the zone You should use the Rectangle tool for this. You can use a lot of things for this You can use the tools I give you when If I go to the chart, I will explain it, similarly when such There will also be a chart, right? So, it is such a There will not be a single line, it will be like this usually There will be one zone, okay, this will be one person like this. Similarly, look above also, there will be such a zone In which margin of errors is your saving grace.
Pending
Support levels are prices where the market repeatedly bounces up after falling, indicating buying interest preventing further decline. Resistance levels are prices where the market repeatedly falls after rising, indicating selling pressure preventing further increase. These act as floors and ceilings for price movements.
Now we will read the next topic. What is Support and Resistance SNR One of the most important topics of Price Action Support and Resistance Support What does it mean to support Resistance means pushing. What do you mean, if it's okay to fight I mean support to you in simple words I explain as if there is a share in the former Company P comes back okay so Purva Company The share of which is there again and again Let's go up to 80, say, 100. It went down and then it went back up to 110. Then it came back down, then back up to 90. He went and came back down, but he didn't even come back once. Not going below 80, okay, below 80. Again and again he is taking touch and going back up. The bar went back to 95 then came back down Then it went back up from 80 as if this If the bar goes to 105 then the price here is 80 But the market does not take support again and again He is taking support, what does this mean? It is not going below this price. and then collides with it and goes back up from where it was He also bumps into it and goes up again and again. support level says okay support level They say and from where he collides again and again goes down which I'm going to draw you guys I will show you if this was the chart. It was like this, then like this, then like this, like this, like this Then I believe this and again I believe this now If I explain it to you people like this, they won't understand. I will explain it to you with numbers. I feel like it is ₹ this is ₹ It is like 75 This is 80 This is ₹ Again this is 0 This is ₹ It's like again ₹ this ₹ 00 that again and again crashing back down from where it came from The market collides with it and goes down. called resistance and from where the market takes support If it repeatedly goes up, it is called support. This happened, the market came crashing down. It went up, it became support and from where The market crashes and falls in a second Yes, from here the market crashed and came down. This is resistance support, meaning floor. Resistance means ceiling if you throw the ball down Throw it and whatever happens to the ground, happens. Your support because hitting the ground It will go back up, take the example of the ball. That's a great example in my mind, friend. Just come, this is the ball, this is the ground below it. Throw it will hit and go back up right ball When thrown down, it will bounce back up. If it goes there, it will hit somewhere and go back up. He is being called support And similarly if the ball is thrown upwards it will hit the ceiling. There must be something on the rooftop, right? It will hit back at the top of your house. If it comes down, it hits where it falls. That's called resistance, okay, I get it.
1 year ago
Pending
Support levels are prices where the market repeatedly bounces up after falling, indicating buying interest preventing further decline. Resistance levels are prices where the market repeatedly falls after rising, indicating selling pressure preventing further increase. These act as floors and ceilings for price movements.
Now we will read the next topic. What is Support and Resistance SNR One of the most important topics of Price Action Support and Resistance Support What does it mean to support Resistance means pushing. What do you mean, if it's okay to fight I mean support to you in simple words I explain as if there is a share in the former Company P comes back okay so Purva Company The share of which is there again and again Let's go up to 80, say, 100. It went down and then it went back up to 110. Then it came back down, then back up to 90. He went and came back down, but he didn't even come back once. Not going below 80, okay, below 80. Again and again he is taking touch and going back up. The bar went back to 95 then came back down Then it went back up from 80 as if this If the bar goes to 105 then the price here is 80 But the market does not take support again and again He is taking support, what does this mean? It is not going below this price. and then collides with it and goes back up from where it was He also bumps into it and goes up again and again. support level says okay support level They say and from where he collides again and again goes down which I'm going to draw you guys I will show you if this was the chart. It was like this, then like this, then like this, like this, like this Then I believe this and again I believe this now If I explain it to you people like this, they won't understand. I will explain it to you with numbers. I feel like it is ₹ this is ₹ It is like 75 This is 80 This is ₹ Again this is 0 This is ₹ It's like again ₹ this ₹ 00 that again and again crashing back down from where it came from The market collides with it and goes down. called resistance and from where the market takes support If it repeatedly goes up, it is called support. This happened, the market came crashing down. It went up, it became support and from where The market crashes and falls in a second Yes, from here the market crashed and came down. This is resistance support, meaning floor. Resistance means ceiling if you throw the ball down Throw it and whatever happens to the ground, happens. Your support because hitting the ground It will go back up, take the example of the ball. That's a great example in my mind, friend. Just come, this is the ball, this is the ground below it. Throw it will hit and go back up right ball When thrown down, it will bounce back up. If it goes there, it will hit somewhere and go back up. He is being called support And similarly if the ball is thrown upwards it will hit the ceiling. There must be something on the rooftop, right? It will hit back at the top of your house. If it comes down, it hits where it falls. That's called resistance, okay, I get it.
Pending
Demand and supply are crucial concepts in price action. When demand increases, the price tends to rise, and when supply increases, the price tends to fall. There's a direct relationship between demand and price, and an inverse relationship between supply and price.
Now that you understand this, you should demand end supply will be very easy to understand okay Understanding demand and supply is now a child's play It will be okay for you guys I I'll just check if the mic is charging in the walk. All good all good Mike's in my charging All the videos are playing fine now. The answer to question number two is three two one Comment immediately 3 I have counted down to 21 I have done it for you guys, please comment if You have not commented yet, okay, ready and done. OK, let's move on to the next topic now. We will learn about demand and supply. The most important thing is price action. There is demand and supply Price If there is an action hero or someone If there is a king then he is Demand and I can supply it to you very easily. Explain beans with watermelon example Let me explain, as if there is one in your entire colony If he is the one selling watermelon, what will happen? He will sell at his own arbitrary price. So it will increase if there was a t of say 80 then it I will sell it for Rs. 100 if someone comes to buy it. I am ready to take it even for 100 rupees if you believe. Ready to buy your entire colony Yes, okay, then he will increase it further and make it 120. Then still ready to buy the colony So he'll increase it further, okay, and at one point The colony will say, brother, this is too much. When she doesn't buy, its price will increase. Will be closed until demand increases The demand is coming till the colony people He can increase the price till you are buying But when the buyers stop Will not be able to increase the price, it has become simple Demand When demand is coming when buyers is available and there are no sellers when There are few sellers, there is only one seller If there are many buyers, it will increase until Don't stop buying until people have If you stop buying it, you will have to stop it. Because it is not selling at that price. It will not be of any use to him right now. Let's talk about supply. Let's talk about importance now. What happened in the case of supply this time 80 It's like it went from 100 to 150 straight away. When it went to 150, then the people of other colony Okay, people from other colonies are selling watermelons. The guys have come, hey brother, we missed out here. If you are doing it here then it is being sold for Rs 50. We are selling it here for ₹, okay? He also came here, okay, what did he do? They have also started selling this too. When people come to sell it at the same price, it Obviously, he has to sell his goods. To sell, you will have to reduce it to 130. Then these people will also say that brother, we have to sell, there is competition going on because There is competition going on as to who will sell it and then do this. When suppliers increase and come and will come and will come when 1000 or 100 when When the watermelon sellers came, they sent them back to their You will have to come in line and come back at the price of 80. If it happens, when the demand increases then the price increases and when supply increases, the price I hope you will understand when the demand falls increases Demand Equals Price And there is a direct relation between price and The relation is that when the demand increases, the price will also increase. will increase when demand falls as we have seen Saw that after a point after 0 colony The people said that now we are not buying, so when If the demand falls then everything that follows The watermelon seller also needs to drop the price. Brother, I can't buy it for this much, let's go back. If we come to 120 then when the demand increases If there is, then the price increases, if the demand increases then Price increases and demand falls The price falls, hopefully you will have understood it. There is a direct relationship between demand and price. Now we will talk about supply and price. When the supply increases When the supply increases The price falls because initially only one The seller was a supply meaning a seller When there was a seller, he could sell it on his own will. was selling for 50 rupees, now when it is 100 rupees When the watermelon seller came, he too had to stand in line. Had to come and reduce the price when When supply increases, the price falls and Supply When it falls, it means if it is like a colony There were 10 watermelon sellers and nine My health suddenly deteriorated, now only one is left. So he will sell one as per his wish. Supply will fall when there are fewer sellers. If you go, he will increase the price. Will increase the supply and price inverse The relation is inverse, meaning the opposite is correct. When the supply increases, the price will fall. If supply falls, the price will rise, I understand. It will happen, I will not pull it now, that's it. This is price action as well as The market also works in the same way. The vegetable market works like this vegetable market as well as our This is how the watermelon market works The stock market also works in the same way. When the price of a share was rising, it was as if That's fine here, we keep writing the price. There were 50 here, there were 60 here. 70 As long as people are buying, as long as people are buying As long as it remains, its price will increase when people I will stop buying when demand drops. Then its price will also start coming down and like this Yes, if we talk about supply, then when only There was one seller and many buyers All the people were there so 50 60 70 50 60 70 continuously It will increase but as soon as the number of sellers increases The number of watermelon sellers had increased. Now the number of watermelon sellers has increased, so the price It will come back down, I understand this is what the price is. Understanding Demand and Supply in Action This is demand and supply, my brother. and on the basis of supply and demand and Supply is the most important concept if If we talk about price auction then because Price action completes work on this basis. It does, okay, now this is our price. About Demand and Supply in Action I hope everyone has noted down everything. You might have downloaded it, if not then I Backing up for a second 3 2 1 note Download it, those who didn't notice it Now you guys go back a little 10 seconds. Make a note, okay, I'm erasing this now.
1 year ago
Pending
Demand and supply are crucial concepts in price action. When demand increases, the price tends to rise, and when supply increases, the price tends to fall. There's a direct relationship between demand and price, and an inverse relationship between supply and price.
Now that you understand this, you should demand end supply will be very easy to understand okay Understanding demand and supply is now a child's play It will be okay for you guys I I'll just check if the mic is charging in the walk. All good all good Mike's in my charging All the videos are playing fine now. The answer to question number two is three two one Comment immediately 3 I have counted down to 21 I have done it for you guys, please comment if You have not commented yet, okay, ready and done. OK, let's move on to the next topic now. We will learn about demand and supply. The most important thing is price action. There is demand and supply Price If there is an action hero or someone If there is a king then he is Demand and I can supply it to you very easily. Explain beans with watermelon example Let me explain, as if there is one in your entire colony If he is the one selling watermelon, what will happen? He will sell at his own arbitrary price. So it will increase if there was a t of say 80 then it I will sell it for Rs. 100 if someone comes to buy it. I am ready to take it even for 100 rupees if you believe. Ready to buy your entire colony Yes, okay, then he will increase it further and make it 120. Then still ready to buy the colony So he'll increase it further, okay, and at one point The colony will say, brother, this is too much. When she doesn't buy, its price will increase. Will be closed until demand increases The demand is coming till the colony people He can increase the price till you are buying But when the buyers stop Will not be able to increase the price, it has become simple Demand When demand is coming when buyers is available and there are no sellers when There are few sellers, there is only one seller If there are many buyers, it will increase until Don't stop buying until people have If you stop buying it, you will have to stop it. Because it is not selling at that price. It will not be of any use to him right now. Let's talk about supply. Let's talk about importance now. What happened in the case of supply this time 80 It's like it went from 100 to 150 straight away. When it went to 150, then the people of other colony Okay, people from other colonies are selling watermelons. The guys have come, hey brother, we missed out here. If you are doing it here then it is being sold for Rs 50. We are selling it here for ₹, okay? He also came here, okay, what did he do? They have also started selling this too. When people come to sell it at the same price, it Obviously, he has to sell his goods. To sell, you will have to reduce it to 130. Then these people will also say that brother, we have to sell, there is competition going on because There is competition going on as to who will sell it and then do this. When suppliers increase and come and will come and will come when 1000 or 100 when When the watermelon sellers came, they sent them back to their You will have to come in line and come back at the price of 80. If it happens, when the demand increases then the price increases and when supply increases, the price I hope you will understand when the demand falls increases Demand Equals Price And there is a direct relation between price and The relation is that when the demand increases, the price will also increase. will increase when demand falls as we have seen Saw that after a point after 0 colony The people said that now we are not buying, so when If the demand falls then everything that follows The watermelon seller also needs to drop the price. Brother, I can't buy it for this much, let's go back. If we come to 120 then when the demand increases If there is, then the price increases, if the demand increases then Price increases and demand falls The price falls, hopefully you will have understood it. There is a direct relationship between demand and price. Now we will talk about supply and price. When the supply increases When the supply increases The price falls because initially only one The seller was a supply meaning a seller When there was a seller, he could sell it on his own will. was selling for 50 rupees, now when it is 100 rupees When the watermelon seller came, he too had to stand in line. Had to come and reduce the price when When supply increases, the price falls and Supply When it falls, it means if it is like a colony There were 10 watermelon sellers and nine My health suddenly deteriorated, now only one is left. So he will sell one as per his wish. Supply will fall when there are fewer sellers. If you go, he will increase the price. Will increase the supply and price inverse The relation is inverse, meaning the opposite is correct. When the supply increases, the price will fall. If supply falls, the price will rise, I understand. It will happen, I will not pull it now, that's it. This is price action as well as The market also works in the same way. The vegetable market works like this vegetable market as well as our This is how the watermelon market works The stock market also works in the same way. When the price of a share was rising, it was as if That's fine here, we keep writing the price. There were 50 here, there were 60 here. 70 As long as people are buying, as long as people are buying As long as it remains, its price will increase when people I will stop buying when demand drops. Then its price will also start coming down and like this Yes, if we talk about supply, then when only There was one seller and many buyers All the people were there so 50 60 70 50 60 70 continuously It will increase but as soon as the number of sellers increases The number of watermelon sellers had increased. Now the number of watermelon sellers has increased, so the price It will come back down, I understand this is what the price is. Understanding Demand and Supply in Action This is demand and supply, my brother. and on the basis of supply and demand and Supply is the most important concept if If we talk about price auction then because Price action completes work on this basis. It does, okay, now this is our price. About Demand and Supply in Action I hope everyone has noted down everything. You might have downloaded it, if not then I Backing up for a second 3 2 1 note Download it, those who didn't notice it Now you guys go back a little 10 seconds. Make a note, okay, I'm erasing this now.
Pending
The markdown phase follows the distribution phase, where the market price continues to decline. This phase is characterized by selling pressure leading to lower prices.
Phase and then after that mark down came simple just finished okay now I Won't complicate it any further now. Let me explain it a little better because I understood it once. If you give it then it will be a little easier now. Okay, enough to explain now. It will get easier, stay with me. Please please please boys please stay All the things till the end of this course You will understand by the end of this course. There won't be a single question in your mind. First we will restart the market. I am going up, I got stuck, I went up, then I got stuck again. Went up, stuck, stuck, came down So this is Acumen. The phase is fine when people said bye then The price increased again and people bought it. riek cuman phase okay because so by If the buyer and the seller are the same The price is increasing, there is only one seller of watermelon. what happened after this when he It has come at an extreme price of Rs 150. When I went, the watermelon seller from the other colony said Hey friend, it is being sold here for Rs 150, let's go. Brother, if we don't go there then when If the sales increase then bring it back to your line. I had to come as if he dropped -20 then It has come to this point that it is called a seller when increased then white in the distribution phase I only write distribution Phase distribution took place after this market The market here went into mark down Mark Down went down in simple words ok if I had stopped in the middle There was a little bit of distribution again. used to call re-distribution if back It used to be there but now there is nothing in the market It went down after distribution. We say mark down hope fully understood It would not have been too complicated You might not have understood, go back a little. Please see and comment, friend, did you understand or not?
1 year ago
Pending
The markdown phase follows the distribution phase, where the market price continues to decline. This phase is characterized by selling pressure leading to lower prices.
Phase and then after that mark down came simple just finished okay now I Won't complicate it any further now. Let me explain it a little better because I understood it once. If you give it then it will be a little easier now. Okay, enough to explain now. It will get easier, stay with me. Please please please boys please stay All the things till the end of this course You will understand by the end of this course. There won't be a single question in your mind. First we will restart the market. I am going up, I got stuck, I went up, then I got stuck again. Went up, stuck, stuck, came down So this is Acumen. The phase is fine when people said bye then The price increased again and people bought it. riek cuman phase okay because so by If the buyer and the seller are the same The price is increasing, there is only one seller of watermelon. what happened after this when he It has come at an extreme price of Rs 150. When I went, the watermelon seller from the other colony said Hey friend, it is being sold here for Rs 150, let's go. Brother, if we don't go there then when If the sales increase then bring it back to your line. I had to come as if he dropped -20 then It has come to this point that it is called a seller when increased then white in the distribution phase I only write distribution Phase distribution took place after this market The market here went into mark down Mark Down went down in simple words ok if I had stopped in the middle There was a little bit of distribution again. used to call re-distribution if back It used to be there but now there is nothing in the market It went down after distribution. We say mark down hope fully understood It would not have been too complicated You might not have understood, go back a little. Please see and comment, friend, did you understand or not?
Pending
The distribution phase occurs when an increase in sellers causes the price to fall. This happens as more sellers enter the market, leading to a shift from buying to selling pressure.
I went and saw if the number of buyers remained the same as It used to be there but now it's replaced by a watermelon shop. If 50 shops come up, then he will no longer be free to do as he pleases. Now he can do 120, 140 as per his wish. I can't sell because there are still more to sell. If there are people selling then now back to the one which sold for 50 Now he was getting back on track. If there is a watermelon for Rs. 80 then buy it. Now you will have to give the right in the market only on pay. Sellers arrived as watermelon sellers increased So its price will fall back okay so when If the sellers come, what can we do to the sellers? They say distributors are fine, so this We also call the phase distribution phase says a little my It might be a little difficult to stay together, but I will explain everything to you guys Okay, I will explain everything to you. First of all our phase happened, Acumen, we are a Work in a distribution phase We mark it in red so that you guys Easy to understand and wait a Second, okay, this distribution happened, I mean Sellers came to the market to sell watermelons The number of people selling watermelons increased again. The price has fallen and the mark-down phase has begun. If it is done then we call it distribution phase.
1 year ago
Pending
The distribution phase occurs when an increase in sellers causes the price to fall. This happens as more sellers enter the market, leading to a shift from buying to selling pressure.
I went and saw if the number of buyers remained the same as It used to be there but now it's replaced by a watermelon shop. If 50 shops come up, then he will no longer be free to do as he pleases. Now he can do 120, 140 as per his wish. I can't sell because there are still more to sell. If there are people selling then now back to the one which sold for 50 Now he was getting back on track. If there is a watermelon for Rs. 80 then buy it. Now you will have to give the right in the market only on pay. Sellers arrived as watermelon sellers increased So its price will fall back okay so when If the sellers come, what can we do to the sellers? They say distributors are fine, so this We also call the phase distribution phase says a little my It might be a little difficult to stay together, but I will explain everything to you guys Okay, I will explain everything to you. First of all our phase happened, Acumen, we are a Work in a distribution phase We mark it in red so that you guys Easy to understand and wait a Second, okay, this distribution happened, I mean Sellers came to the market to sell watermelons The number of people selling watermelons increased again. The price has fallen and the mark-down phase has begun. If it is done then we call it distribution phase.
Pending
The markup phase follows the accumulation phase, driven by the increased demand and rising prices resulting from earlier buying activity. The market continues to move upwards during this phase.
After that the market went up because The markup phase has arrived, look, the markup phase has arrived. So first of all, what happened, think carefully once Look, first came the acumen phase, then after that Then came the markup phase because now there's so much There was demand and people bought so much. If its price increases then the markup phase comes After that Acumen phase aa because not continuously so It will keep growing, a time will come when it will stop. A little bit will not increase continuously came back later ri akyu mulen ri akyu Mullen is back in business Started buying again, this time back The price has gone up again Mark up okay again mark Up what happened after this it happened pause The phase is fine, now you can see it from here. The price has fallen, so it means buy now. There are fewer buyers or there are more sellers.
1 year ago
Pending
The markup phase follows the accumulation phase, driven by the increased demand and rising prices resulting from earlier buying activity. The market continues to move upwards during this phase.
After that the market went up because The markup phase has arrived, look, the markup phase has arrived. So first of all, what happened, think carefully once Look, first came the acumen phase, then after that Then came the markup phase because now there's so much There was demand and people bought so much. If its price increases then the markup phase comes After that Acumen phase aa because not continuously so It will keep growing, a time will come when it will stop. A little bit will not increase continuously came back later ri akyu mulen ri akyu Mullen is back in business Started buying again, this time back The price has gone up again Mark up okay again mark Up what happened after this it happened pause The phase is fine, now you can see it from here. The price has fallen, so it means buy now. There are fewer buyers or there are more sellers.
Pending
The accumulation phase is characterized by increased buying activity in the market due to rising demand, which leads to an increase in prices. This phase is driven by buyers influencing the market.
There are certain areas of the market structures are now very carefully Understand that the first phase is the acumen phase. Acumen Phase Meaning acumatica From Buying is fine, buying is here in the market But buying is going on, okay buying here. Buying is happening Buying is happening because it's happening because of his The demand is increasing because that thing If it is in demand, its price increases. I will give you an example, if you There is only one shop in the colony which is She sells things as if for example, there is only one Watermelon sellers are fine in the entire area. There's only one watermelon seller in the entire colony. It is there and not everyone knows who buys it. If you suddenly feel like eating watermelon Because now so many people are demanding it. what will he say, look brother, I bought this for ₹1 He is selling it, if you want to buy it then take it. You can also tell the other person that brother, I am 120 I am selling it, if you want to buy it then take it. Because other people are ready to take it. When there were many buyers in the market If it is there then the prices of things increase. increases and so does the buying of things If there are fewer people, its price falls. This is what we call demand and supply. I will explain it in full detail here. I'll mark it down okay it's here It's been buying buying buying buying buying Then there is the market markup phase. went upstairs started running then after that What happened to the market for a while? Wait, okay, where the buying happened, Acumen phase says okay write it all down people carefully AQ Mullen phase where buying happens okay
1 year ago
Pending
The accumulation phase is characterized by increased buying activity in the market due to rising demand, which leads to an increase in prices. This phase is driven by buyers influencing the market.
There are certain areas of the market structures are now very carefully Understand that the first phase is the acumen phase. Acumen Phase Meaning acumatica From Buying is fine, buying is here in the market But buying is going on, okay buying here. Buying is happening Buying is happening because it's happening because of his The demand is increasing because that thing If it is in demand, its price increases. I will give you an example, if you There is only one shop in the colony which is She sells things as if for example, there is only one Watermelon sellers are fine in the entire area. There's only one watermelon seller in the entire colony. It is there and not everyone knows who buys it. If you suddenly feel like eating watermelon Because now so many people are demanding it. what will he say, look brother, I bought this for ₹1 He is selling it, if you want to buy it then take it. You can also tell the other person that brother, I am 120 I am selling it, if you want to buy it then take it. Because other people are ready to take it. When there were many buyers in the market If it is there then the prices of things increase. increases and so does the buying of things If there are fewer people, its price falls. This is what we call demand and supply. I will explain it in full detail here. I'll mark it down okay it's here It's been buying buying buying buying buying Then there is the market markup phase. went upstairs started running then after that What happened to the market for a while? Wait, okay, where the buying happened, Acumen phase says okay write it all down people carefully AQ Mullen phase where buying happens okay
Pending
A sideways trend occurs when market highs and lows are trading at approximately the same level, creating a range without a clear upward or downward direction.
Another trend is sideways in which What are highs and lows in the market? They are almost at the same level, okay? Now he calls them equal highs and equal lows. But if we do not understand it now, then very It will be too much, okay, it's done. The trend is this, down trend and this is Gaya Side Veg Market Side Veg Market Now Dekho Already The market structure has become so much But still a lot to talk about The rest is fine if you want to learn price action. So this will be the entire course, okay, not even one thing. I am not missing out on this one. Things will be fine, everything will be done in the next The thing that will remain is that there is actually a market. Understanding the Structure of Market Structure there are some parts okay now you It will be a little difficult, a little bit Slowly see if this portion is okay in the market There is always a zone in the market which There is a structure, I will explain it to you guys.
1 year ago
Pending
A sideways trend occurs when market highs and lows are trading at approximately the same level, creating a range without a clear upward or downward direction.
Another trend is sideways in which What are highs and lows in the market? They are almost at the same level, okay? Now he calls them equal highs and equal lows. But if we do not understand it now, then very It will be too much, okay, it's done. The trend is this, down trend and this is Gaya Side Veg Market Side Veg Market Now Dekho Already The market structure has become so much But still a lot to talk about The rest is fine if you want to learn price action. So this will be the entire course, okay, not even one thing. I am not missing out on this one. Things will be fine, everything will be done in the next The thing that will remain is that there is actually a market. Understanding the Structure of Market Structure there are some parts okay now you It will be a little difficult, a little bit Slowly see if this portion is okay in the market There is always a zone in the market which There is a structure, I will explain it to you guys.
Pending
A downtrend is identified when the market makes lower highs and lower lows.
Okay, let me draw a little and show you. If there are both highs and lows in the market It started going downwards, it went high up all the points are high okay and All the points below are low, okay? Hai lo lo and lo whenever hygge hygge hygge and Los Los Los starts going downwards This is called a downtrend and is below the previous high. In comparison, because it is below, it lower high say okay lower high lower This is down compared to the high and the previous low. then lower it Take it and lower it, okay, I have come more When highs are higher in the complex now market If we go higher, we will call it higher market. When the hygge come down come down Okay, so for the bottom, it's called Lower Highs. It is said that the same losses which are at the lower point When he goes up he gets higher lows And when the logs come down a little bit
1 year ago
Pending
A downtrend is identified when the market makes lower highs and lower lows.
Okay, let me draw a little and show you. If there are both highs and lows in the market It started going downwards, it went high up all the points are high okay and All the points below are low, okay? Hai lo lo and lo whenever hygge hygge hygge and Los Los Los starts going downwards This is called a downtrend and is below the previous high. In comparison, because it is below, it lower high say okay lower high lower This is down compared to the high and the previous low. then lower it Take it and lower it, okay, I have come more When highs are higher in the complex now market If we go higher, we will call it higher market. When the hygge come down come down Okay, so for the bottom, it's called Lower Highs. It is said that the same losses which are at the lower point When he goes up he gets higher lows And when the logs come down a little bit
Pending
An uptrend is characterized by the market making higher highs and higher lows, visually represented by an upward sloping trendline.
When there are higher highs and higher lows in the market If I draw a line like this, then see if it will be made I'll change its color so that You guys can see it better Look, the market is going up. Correct Higher If highs and higher lows are made in the market then The market moves into an uptrend. We say up trend now I more I don't want to explain, similarly if there is a loss in the market and Heise both started going downhill
1 year ago
Pending
An uptrend is characterized by the market making higher highs and higher lows, visually represented by an upward sloping trendline.
When there are higher highs and higher lows in the market If I draw a line like this, then see if it will be made I'll change its color so that You guys can see it better Look, the market is going up. Correct Higher If highs and higher lows are made in the market then The market moves into an uptrend. We say up trend now I more I don't want to explain, similarly if there is a loss in the market and Heise both started going downhill
Pending
An inside bar pattern occurs when a new candlestick's trading range (high to low) is completely contained within the trading range of the previous candlestick. This is a notable pattern used by many traders.
Similarly, one hour candlesticks I will give you an example of Purva Company. It goes with the example, okay Purva Company Purab Company Ka Mano A Abhi Time Ho It's like it's 6:00 in the morning I am recording a video at 6 AM And this is a 6m to 7m candle, okay 6 This candle is from 1M to 7M and is of 1 hour duration. The candle is fine, the price will be 50 in an hour. It was there then it went to ₹ then what happened after that Then it will be from 7 to 8 o'clock, then from 8 to 9 o'clock, like this Time will pass and then believe in the next one This is the hour candle, then the next hour candle candle is this then another hourly candle is this If six to seven is the first one hour The candle was fine, which was between 50 and 60 I was there, if the market did not go above that also in the next three to four hours and even below that The market neither went above 60 nor below 50. Up and down it's been inside once This 1 hour bar inside a bar below It was an hour's candle, however many the next Candles came and they stayed inside it, okay. Not even as many as it is, just the next candle too. If it remains inside then it is called inside bar Okay, so let's say this 6 to 7:00 o'clock candle Then there was this 7:00 to 8:00 o'clock candle The 7:00 to 8:00 o'clock candle came so small And the boat remained inside this candle. It went below 50, it went above 60. Meaning this inside bar candlestick has formed. This is a kind of pattern, it is quite It is very famous and is used by many people.
1 year ago
Pending
An inside bar pattern occurs when a new candlestick's trading range (high to low) is completely contained within the trading range of the previous candlestick. This is a notable pattern used by many traders.
Similarly, one hour candlesticks I will give you an example of Purva Company. It goes with the example, okay Purva Company Purab Company Ka Mano A Abhi Time Ho It's like it's 6:00 in the morning I am recording a video at 6 AM And this is a 6m to 7m candle, okay 6 This candle is from 1M to 7M and is of 1 hour duration. The candle is fine, the price will be 50 in an hour. It was there then it went to ₹ then what happened after that Then it will be from 7 to 8 o'clock, then from 8 to 9 o'clock, like this Time will pass and then believe in the next one This is the hour candle, then the next hour candle candle is this then another hourly candle is this If six to seven is the first one hour The candle was fine, which was between 50 and 60 I was there, if the market did not go above that also in the next three to four hours and even below that The market neither went above 60 nor below 50. Up and down it's been inside once This 1 hour bar inside a bar below It was an hour's candle, however many the next Candles came and they stayed inside it, okay. Not even as many as it is, just the next candle too. If it remains inside then it is called inside bar Okay, so let's say this 6 to 7:00 o'clock candle Then there was this 7:00 to 8:00 o'clock candle The 7:00 to 8:00 o'clock candle came so small And the boat remained inside this candle. It went below 50, it went above 60. Meaning this inside bar candlestick has formed. This is a kind of pattern, it is quite It is very famous and is used by many people.
Pending
Trend trading involves identifying the market's direction (up or down) and trading in alignment with that trend. It means participating in the direction the market is moving, rather than opposing it, and suggests that traders should follow the market's momentum.
Trend Trading Meaning of Trend Trading I'll tell you the market is going up. The market is going up, you are going up What did you do, bought it in the market in between went up and sold it in the direction in which Trade in the direction the market was going Doing trend trading means you The market was going up, it doesn't mean you It seemed like the market was going up. Did you take advantage of it going up or When the market was going down, it was going down. You sold it means when the price was rising If it is there then don't interfere with it quietly Buy when it increases and sell when it increases, this has become the trend. Trading means doing what the market wants. is happening or what the chart is trying to do Don't oppose it, it's not like you feel It's like talking about former company What was the price in the past, always 50 to 60 It was in the middle, okay, now it has gone from 60 to 70. 70 to 80 have gone, some people will come sir You will think that brother, it has grown so much, now it will come back. It will come down when the market is going up Then you also go up quietly, you will keep more of your Don't worry when the market is going up. Go up with the market when the market going down along with the market Go ahead, just study the rest of the things a little bit. Do that as an expert, you guys I am not an expert but if you When will you learn price action etc. We have to go against the market and that too You will learn the meaning of trend trading. Be smart when the market is going up I don't have to do it, I have to go up with the market. When the market is going down, the market Moving Down Together Inside Bar Trading I will explain the whole strategy later, but for now Let me explain a little bit, as if for For example, what will we do now? I such as an hourly candlestick I have given you guys an example so far.
1 year ago
Pending
Trend trading involves identifying the market's direction (up or down) and trading in alignment with that trend. It means participating in the direction the market is moving, rather than opposing it, and suggests that traders should follow the market's momentum.
Trend Trading Meaning of Trend Trading I'll tell you the market is going up. The market is going up, you are going up What did you do, bought it in the market in between went up and sold it in the direction in which Trade in the direction the market was going Doing trend trading means you The market was going up, it doesn't mean you It seemed like the market was going up. Did you take advantage of it going up or When the market was going down, it was going down. You sold it means when the price was rising If it is there then don't interfere with it quietly Buy when it increases and sell when it increases, this has become the trend. Trading means doing what the market wants. is happening or what the chart is trying to do Don't oppose it, it's not like you feel It's like talking about former company What was the price in the past, always 50 to 60 It was in the middle, okay, now it has gone from 60 to 70. 70 to 80 have gone, some people will come sir You will think that brother, it has grown so much, now it will come back. It will come down when the market is going up Then you also go up quietly, you will keep more of your Don't worry when the market is going up. Go up with the market when the market going down along with the market Go ahead, just study the rest of the things a little bit. Do that as an expert, you guys I am not an expert but if you When will you learn price action etc. We have to go against the market and that too You will learn the meaning of trend trading. Be smart when the market is going up I don't have to do it, I have to go up with the market. When the market is going down, the market Moving Down Together Inside Bar Trading I will explain the whole strategy later, but for now Let me explain a little bit, as if for For example, what will we do now? I such as an hourly candlestick I have given you guys an example so far.
Pending
A breakout occurs when a price moves beyond a previous resistance level, and a breakdown occurs when a price moves below a previous support level. These are trading opportunities based on price action.
breakouts and breakdowns A strategy that is based on price action You can trade on the basis of a little Let me explain quickly, just say Your mom told you not to buy mangoes. Bheja or lettuce for example potatoes I will send you to the vegetable market to buy it. Diya Mummy said that it is between 50 and 0 Its price should come to me per kg. I don't know what the price is, I don't go. Yes brother, but I believe that your mother He said whatever you say, potato is fine. What do you call potatoes? Mummy said that the price of potatoes is It should be between 50 and 60. Not above, not below, said mom. If it is more expensive than that then don't buy it, okay? Similarly, there is a range for everything. I agree this is Purab company again okay Purva Company charges Rs. 50 to 60 It is running in the middle now, between 50 and 60. When its price is going up, what about one day? Done, he broke 60 and achieved 70 So this is what has always been going on between 60 Today it has achieved a new level. It's called a breakout and right here if it goes down Instead of 70, it would have been like he was going towards 50. If it had broken and reached 40 then this breakdown If the level were in the upward direction If it breaks then it is called break out. and if the break in the downward direction If it does, it says breakdown, note it down.
1 year ago
Pending
A breakout occurs when a price moves beyond a previous resistance level, and a breakdown occurs when a price moves below a previous support level. These are trading opportunities based on price action.
breakouts and breakdowns A strategy that is based on price action You can trade on the basis of a little Let me explain quickly, just say Your mom told you not to buy mangoes. Bheja or lettuce for example potatoes I will send you to the vegetable market to buy it. Diya Mummy said that it is between 50 and 0 Its price should come to me per kg. I don't know what the price is, I don't go. Yes brother, but I believe that your mother He said whatever you say, potato is fine. What do you call potatoes? Mummy said that the price of potatoes is It should be between 50 and 60. Not above, not below, said mom. If it is more expensive than that then don't buy it, okay? Similarly, there is a range for everything. I agree this is Purab company again okay Purva Company charges Rs. 50 to 60 It is running in the middle now, between 50 and 60. When its price is going up, what about one day? Done, he broke 60 and achieved 70 So this is what has always been going on between 60 Today it has achieved a new level. It's called a breakout and right here if it goes down Instead of 70, it would have been like he was going towards 50. If it had broken and reached 40 then this breakdown If the level were in the upward direction If it breaks then it is called break out. and if the break in the downward direction If it does, it says breakdown, note it down.
Pending
Retracements are short-term pullbacks within a trend, while reversals signify a significant change in the overall trend direction, potentially triggered by news or company-specific events.
Retracement's brother is reversal now I will try to explain it in short. I will do it so that I don't waste too much time on this. Market in cheese as we talked about If it goes up, it will come down someday too. Sometimes it will come down and sometimes it will turn around If the market has gone from 80 to 100 then it may be It seems as if some news has come or as if something If the company goes bad and closes down, the price It is okay if it falls even below, say it reaches 60. This is the price that has turned upside down first. It was going towards it, then it started coming down. says reversal okay it's done Reversal is like a price movement The earth was falling as if it had some company. The price fell and fell to 50 and then Then she got up immediately, okay, when she was falling After that he turned around, meaning reversal. Reversal means taking and reversing What does reversal and retracement mean? A little correction every now and then Taking it as it was going up down the middle came a little bit and then went back up Retracement means short term Corrections okay and the reversals that happen that is a Change in the direction of the movement by This is called a change in the direction of the trend. But change in the direction of the movement
1 year ago
Pending
Retracements are short-term pullbacks within a trend, while reversals signify a significant change in the overall trend direction, potentially triggered by news or company-specific events.
Retracement's brother is reversal now I will try to explain it in short. I will do it so that I don't waste too much time on this. Market in cheese as we talked about If it goes up, it will come down someday too. Sometimes it will come down and sometimes it will turn around If the market has gone from 80 to 100 then it may be It seems as if some news has come or as if something If the company goes bad and closes down, the price It is okay if it falls even below, say it reaches 60. This is the price that has turned upside down first. It was going towards it, then it started coming down. says reversal okay it's done Reversal is like a price movement The earth was falling as if it had some company. The price fell and fell to 50 and then Then she got up immediately, okay, when she was falling After that he turned around, meaning reversal. Reversal means taking and reversing What does reversal and retracement mean? A little correction every now and then Taking it as it was going up down the middle came a little bit and then went back up Retracement means short term Corrections okay and the reversals that happen that is a Change in the direction of the movement by This is called a change in the direction of the trend. But change in the direction of the movement
Pending
The market price does not move in a straight line; it experiences short-term pullbacks called 'retracements' where it moves against the primary trend before continuing its movement.
Look at the chart, the price is never like this. It goes up, okay, look at the market. The price will never go like this for example If the price of something is 80 then 81 82 83 84 85 86 87 like this continuously till 100 If she doesn't go, what will she do? She will go up to 85. It will come down a little bit, then it will go up again. It will come down a little, then it will go up a little. If we come down a little, then this little thing in between It is coming down, isn't it? We call it retracement. Nothing Retracement Are Short Term Pull Banks, okay, write that a little bit there.
1 year ago
Pending
The market price does not move in a straight line; it experiences short-term pullbacks called 'retracements' where it moves against the primary trend before continuing its movement.
Look at the chart, the price is never like this. It goes up, okay, look at the market. The price will never go like this for example If the price of something is 80 then 81 82 83 84 85 86 87 like this continuously till 100 If she doesn't go, what will she do? She will go up to 85. It will come down a little bit, then it will go up again. It will come down a little, then it will go up a little. If we come down a little, then this little thing in between It is coming down, isn't it? We call it retracement. Nothing Retracement Are Short Term Pull Banks, okay, write that a little bit there.
Pending
The speaker downplays the significance of the 'inside bar' strategy, stating it's not particularly special and should not be the sole basis for trading.
All the strategists, like me, some people I will write something trending Trading will understand everything ahead, trend What happens, how is the market structure? All these things happen inside this bar. I don't believe that much inside bar I don't think this one is that special There is a strategy, but I don't think there is much It is special because based on a strategy You should never relive that again After that trade on the basis of retracement Let me explain further what retracements are Well, let me explain it in short.
1 year ago
Pending
The speaker downplays the significance of the 'inside bar' strategy, stating it's not particularly special and should not be the sole basis for trading.
All the strategists, like me, some people I will write something trending Trading will understand everything ahead, trend What happens, how is the market structure? All these things happen inside this bar. I don't believe that much inside bar I don't think this one is that special There is a strategy, but I don't think there is much It is special because based on a strategy You should never relive that again After that trade on the basis of retracement Let me explain further what retracements are Well, let me explain it in short.
Pending
Price action is presented as a superior and more powerful method of trading compared to using indicators. The speaker emphasizes that price action alone is sufficient for understanding market direction and making profitable trades, negating the need for indicators, which are likened to a 'knife' when a 'tank' (price action) is available. Price action analysis leads to cleaner charts with no noise and higher chances of profitability.
I don't want to criticize indicators. I'm just trying to tell you that you may have indicators As if the indicators are like a sword near you like okay or like a knife It's a knife, like you're going to fight a war. Yes, you have a knife, indicator, and Talk about price, price action or Talking about the price, Pure Price tank for you When you have a tank, you can get down and Why would you take a knife and go kill the enemy? What I want to highlight is the price The action is so strong that you will not be able to You won't need an indicator. 10 different types of trading on a chart Photos or 10 different drawings needed It is not pure, just look at the chart and tell me. How do you know where the market is going? is going to move and how do I get into it I can make a profit, okay, this is the price. The Power of Price Action Directly we move forward The Definition Study on the Study of Price Age of price is called price action I that I have already explained it to you and now we will move ahead. What are the benefits of price action? The advantage of price action is that the price The action is compared to whatever else We looked at the analysis of the press. Okay, pressure is there, meaning there are chances of it. Of profitability are much higher in this The chances are quite high, the second thing Your chart is absolutely without any noise.
1 year ago
Pending
Price action is presented as a superior and more powerful method of trading compared to using indicators. The speaker emphasizes that price action alone is sufficient for understanding market direction and making profitable trades, negating the need for indicators, which are likened to a 'knife' when a 'tank' (price action) is available. Price action analysis leads to cleaner charts with no noise and higher chances of profitability.
I don't want to criticize indicators. I'm just trying to tell you that you may have indicators As if the indicators are like a sword near you like okay or like a knife It's a knife, like you're going to fight a war. Yes, you have a knife, indicator, and Talk about price, price action or Talking about the price, Pure Price tank for you When you have a tank, you can get down and Why would you take a knife and go kill the enemy? What I want to highlight is the price The action is so strong that you will not be able to You won't need an indicator. 10 different types of trading on a chart Photos or 10 different drawings needed It is not pure, just look at the chart and tell me. How do you know where the market is going? is going to move and how do I get into it I can make a profit, okay, this is the price. The Power of Price Action Directly we move forward The Definition Study on the Study of Price Age of price is called price action I that I have already explained it to you and now we will move ahead. What are the benefits of price action? The advantage of price action is that the price The action is compared to whatever else We looked at the analysis of the press. Okay, pressure is there, meaning there are chances of it. Of profitability are much higher in this The chances are quite high, the second thing Your chart is absolutely without any noise.
Pending
Over-reliance on indicators can make traders vulnerable and dependent, hindering their ability to study charts directly. Trading solely based on indicators is presented as a simplistic approach that is unlikely to be effective.
If you rely to Much is fine if you rely too much on Indicators then what happens is you as a Traders become vulnerable because you are in the market You just can't study The indicator is telling you this, go ahead. This indicator is going to be here and there Let's take a trade like for example We go to the charts to understand you. It will be a little difficult so I will directly I will tell you by doing it, like many There are strategies that you consider two Put indicators on let's say for example We work as you see here. It is written technicals, this technical there are indicators okay let's see some people I use moving averages right now. showing for okay a one any We simply use the moving average or Then use EAMA, you could have used an EM. For you guys, it all makes sense now. It won't come as if you guys have played a triple You have used the EA, okay you have used it. If you had taken something like this, you would have been told this That is, when EA is like this then you will be like this. Taking a trade is indicator based. Trading or Indicator Based Strategy Now Tell me if trading was that easy You made one line and then one or two And drew a line as if this was a chart for For example, there was a chart like this between one of the lines came some people will say a And put another EMA AMA or else Put baller bands along with it, if this happens then such If taking trades were so easy that it would be barren Bands installed or one or two indicators If you have placed an order and this happens, then take the trade. It doesn't happen like that, okay, so if you believe Too much on indicators so your losses too You can grow up and fail as a trader. You will be because you will not be able to trade. You are living according to yourself, you are just indicators You have become a slave, okay I hope you understand.
1 year ago
Pending
Over-reliance on indicators can make traders vulnerable and dependent, hindering their ability to study charts directly. Trading solely based on indicators is presented as a simplistic approach that is unlikely to be effective.
If you rely to Much is fine if you rely too much on Indicators then what happens is you as a Traders become vulnerable because you are in the market You just can't study The indicator is telling you this, go ahead. This indicator is going to be here and there Let's take a trade like for example We go to the charts to understand you. It will be a little difficult so I will directly I will tell you by doing it, like many There are strategies that you consider two Put indicators on let's say for example We work as you see here. It is written technicals, this technical there are indicators okay let's see some people I use moving averages right now. showing for okay a one any We simply use the moving average or Then use EAMA, you could have used an EM. For you guys, it all makes sense now. It won't come as if you guys have played a triple You have used the EA, okay you have used it. If you had taken something like this, you would have been told this That is, when EA is like this then you will be like this. Taking a trade is indicator based. Trading or Indicator Based Strategy Now Tell me if trading was that easy You made one line and then one or two And drew a line as if this was a chart for For example, there was a chart like this between one of the lines came some people will say a And put another EMA AMA or else Put baller bands along with it, if this happens then such If taking trades were so easy that it would be barren Bands installed or one or two indicators If you have placed an order and this happens, then take the trade. It doesn't happen like that, okay, so if you believe Too much on indicators so your losses too You can grow up and fail as a trader. You will be because you will not be able to trade. You are living according to yourself, you are just indicators You have become a slave, okay I hope you understand.
Pending
Technical analysis heavily relies on indicators, which are often lagging (showing what has already happened) and create 'noise' on charts with too many drawings, making analysis difficult. Price action, in contrast, is presented as a cleaner, more direct way to understand market movements.
Now I will tell you little about technical analysis I had to tell many people technical Analysis, one second, I messed up the spelling a little bit. make mess Diya, it's okay, many people should not get confused Technical analysis is known to Why use price action in comparisons Why not use technical analysis? You should look into technical analysis Majorly you guys rely on indicators Yes, you rely on technical indicators to d charts Okay, now you rely on the indicators. The first thing you need to know is whether this The indicators are actually reliable. If they are reliable then we can rely Yes, but are they reliable? Let me tell you where the indicators are looking in What has become of nature lagging? It means as we say the phone lags Is it gone or is my video lagging? what does it mean it is lagging This would mean that what has already happened He tells you what it means to market If you're going to go up, let's get you Looking at the indicator, it seems that the market is up He is going to leave, it means he has already gone upstairs. The indicator tells you what This is the first thing that has already happened in the market. Okay, indicators are lagging in nature. Write things down, note down everything that What I'm saying is fine We will now look at what indicators are. Within a short time, people who do not I know, okay, the second thing is indicators charts. Too much noise on The chart is visible, now what is above it? If I tell you about the indicators, There will be 15-20 such drawings like this one These, these, these, I gave you indicators. Now, when I see a chart like this, I will tell you Where can you even analyze people? Okay, this is the clean chart now that you Butt clean is visible in front of people The market will not be clean, then the chart will not be It will remain when you have many Indicators have been installed when it will not remain clean. then him Nine is going to tell him that he has a lot of Things have come that now the chart is not visible. It is happening brother when the chart itself is not visible So what will you trade?
1 year ago
Pending
Technical analysis heavily relies on indicators, which are often lagging (showing what has already happened) and create 'noise' on charts with too many drawings, making analysis difficult. Price action, in contrast, is presented as a cleaner, more direct way to understand market movements.
Now I will tell you little about technical analysis I had to tell many people technical Analysis, one second, I messed up the spelling a little bit. make mess Diya, it's okay, many people should not get confused Technical analysis is known to Why use price action in comparisons Why not use technical analysis? You should look into technical analysis Majorly you guys rely on indicators Yes, you rely on technical indicators to d charts Okay, now you rely on the indicators. The first thing you need to know is whether this The indicators are actually reliable. If they are reliable then we can rely Yes, but are they reliable? Let me tell you where the indicators are looking in What has become of nature lagging? It means as we say the phone lags Is it gone or is my video lagging? what does it mean it is lagging This would mean that what has already happened He tells you what it means to market If you're going to go up, let's get you Looking at the indicator, it seems that the market is up He is going to leave, it means he has already gone upstairs. The indicator tells you what This is the first thing that has already happened in the market. Okay, indicators are lagging in nature. Write things down, note down everything that What I'm saying is fine We will now look at what indicators are. Within a short time, people who do not I know, okay, the second thing is indicators charts. Too much noise on The chart is visible, now what is above it? If I tell you about the indicators, There will be 15-20 such drawings like this one These, these, these, I gave you indicators. Now, when I see a chart like this, I will tell you Where can you even analyze people? Okay, this is the clean chart now that you Butt clean is visible in front of people The market will not be clean, then the chart will not be It will remain when you have many Indicators have been installed when it will not remain clean. then him Nine is going to tell him that he has a lot of Things have come that now the chart is not visible. It is happening brother when the chart itself is not visible So what will you trade?
Pending
A candlestick indicates the opening, closing, high, and low price of an asset within a specific timeframe. Green candles signify a price increase, while red candles signify a price decrease.
Now I will tell you guys a what is a candlestick okay a candle This is how the stick looks after We will understand candlesticks in detail. Okay, this is how a candlestick looks like. Now let me explain a little more to you. I will not go into depth about this because You have to read it in detail as if it is a candlestick is one hour long okay just assume For now, just consider this a candlestick. If it's an hour old, what does it tell you? If it is green in colour, for example Green, I simply tell you the stock In market parlance, green means above red. Meaning below is ok if green means price Increase in red means fall in price, simple It is so clear that green and red are visible at some places. It will remain white instead of green, some brokers inside, however, it has been closed nowadays and Black will replace red, but today it will always be green. And you will only see red, okay now. Let's say this is a green candle, okay, green. If you see a candle on one side This means the price has gone up. Okay, now a If this is a candle of the hour, then you should It could even be for 1 minute, it's up to you. It happens now listen carefully beginners It will take an hour to understand If this is a candle, it will tell you for For example, this candle is from 2 pm to 3:00 pm. So it will tell you that at 2 o'clock this company At what price did the price start And at what price did it end, that is, at 2 o'clock What was the price, let's say for example ₹1 It had a price at 2:00 and it was like at 3:00. If it becomes ₹10 then what is this candle worth to you? It will tell that from ₹1 this price went up to ₹10 and Because it has gone up, this candle It becomes green, nothing complicated It's simple, the candle tells you that a The price of the share within that particular time Which we have just selected 1R. The hour selected is 2 to 3:00 pm If it is of then market is open between 2 to 3:00 pm Where did it open, meaning where was its price? It started at 2 o'clock and ended at 3:00 o'clock. Okay, so let's call this a candlestick.
1 year ago
Pending
A candlestick indicates the opening, closing, high, and low price of an asset within a specific timeframe. Green candles signify a price increase, while red candles signify a price decrease.
Now I will tell you guys a what is a candlestick okay a candle This is how the stick looks after We will understand candlesticks in detail. Okay, this is how a candlestick looks like. Now let me explain a little more to you. I will not go into depth about this because You have to read it in detail as if it is a candlestick is one hour long okay just assume For now, just consider this a candlestick. If it's an hour old, what does it tell you? If it is green in colour, for example Green, I simply tell you the stock In market parlance, green means above red. Meaning below is ok if green means price Increase in red means fall in price, simple It is so clear that green and red are visible at some places. It will remain white instead of green, some brokers inside, however, it has been closed nowadays and Black will replace red, but today it will always be green. And you will only see red, okay now. Let's say this is a green candle, okay, green. If you see a candle on one side This means the price has gone up. Okay, now a If this is a candle of the hour, then you should It could even be for 1 minute, it's up to you. It happens now listen carefully beginners It will take an hour to understand If this is a candle, it will tell you for For example, this candle is from 2 pm to 3:00 pm. So it will tell you that at 2 o'clock this company At what price did the price start And at what price did it end, that is, at 2 o'clock What was the price, let's say for example ₹1 It had a price at 2:00 and it was like at 3:00. If it becomes ₹10 then what is this candle worth to you? It will tell that from ₹1 this price went up to ₹10 and Because it has gone up, this candle It becomes green, nothing complicated It's simple, the candle tells you that a The price of the share within that particular time Which we have just selected 1R. The hour selected is 2 to 3:00 pm If it is of then market is open between 2 to 3:00 pm Where did it open, meaning where was its price? It started at 2 o'clock and ended at 3:00 o'clock. Okay, so let's call this a candlestick.
Pending
The speaker identifies three main chart types: line charts (deemed useless for analysis), bar charts (also considered not useful), and candlestick charts (which are considered the 'king' and will be the primary focus).
See there are many ways charts are okay major types of I'll let you guys know the charts. First is a line chart, okay, one line. There is a chart that looks something like this If you open the market, you will see a line chart. This way you will see just a single C You will see a line, okay, line chart. Absolutely useless for analysis Okay, simple for now, line chart. Remove the line chart from your book, okay? We immediately took it and erased it. Then there are many charts after this Just like bar charts are bar charts doesn't look anything like that There are some people like that, friends, they are that much shaped I am not important to you people I'm writing it down for you, okay? Next is Bars Charts Bars Charts These are absolutely useful If there is no bass chart then remove it, okay then Then comes the candlestick Chart: We will go ahead and talk about candlesticks. I will also understand and this candlestick chart Whoever remains will remain your king, okay?
1 year ago
Pending
The speaker identifies three main chart types: line charts (deemed useless for analysis), bar charts (also considered not useful), and candlestick charts (which are considered the 'king' and will be the primary focus).
See there are many ways charts are okay major types of I'll let you guys know the charts. First is a line chart, okay, one line. There is a chart that looks something like this If you open the market, you will see a line chart. This way you will see just a single C You will see a line, okay, line chart. Absolutely useless for analysis Okay, simple for now, line chart. Remove the line chart from your book, okay? We immediately took it and erased it. Then there are many charts after this Just like bar charts are bar charts doesn't look anything like that There are some people like that, friends, they are that much shaped I am not important to you people I'm writing it down for you, okay? Next is Bars Charts Bars Charts These are absolutely useful If there is no bass chart then remove it, okay then Then comes the candlestick Chart: We will go ahead and talk about candlesticks. I will also understand and this candlestick chart Whoever remains will remain your king, okay?
Pending
The speaker outlines various trading styles: scalping (very short term, minutes), day trading (within the same day), swing trading (days to weeks), positional trading (months), and investment (years). BTST (Buy Today Sell Tomorrow) is also mentioned as a short-term trade.
See the many ways to trade in the market The first method is that trading okay day trading or it Intraday trading is also called second Here comes the swing Trading, then comes positional Trading and one happens The investment is fine and that futures end Put the options aside, it's not about now. are doing and a lot before day trading Sculpin comes to the people from I will tell you all types of trading Let me explain it in this order I'm going to assume you guys are all beginners. Those who know more about the market Not just learning trading I'm sculpin' if you hear me I will tell you the meaning of sculpin Sculpin is very short term The trades take a few minutes for the market to go up. You said goodbye within a few minutes. The market went up, you left, this happened. Sculpin is a 2 minute, 3 minute, 4 minute Trades Trading within minutes Sell Doing by doing this is scalping in it. Make a profit and get out of this sculpin Look, the market is going up, it's going up. You caught a little momentum for 1 minute. I took the trade in and exited, it's over. Done sculpin ok sculpin it which is very short term ok then within a day Buy and sell within the same day For example, you bought an ADAC, okay? Let's take a number like this on 000 I bought it, though it is not of Hajj price but I Just for example, for simplification Bought at 000 1000 becomes 0, as if ₹1 becomes 5 You book a profit of ₹ and exit This is done with day trading, okay then that Swing trading which happens after a few days from a few weeks to from a few Days to weeks is it okay to trade or else Buy and sell anything, any share Selling that is swing trading the most The smaller Sculpin came next. Trading Then Came Swing Trading Swing trading from a few days to a few weeks Till positional trading which happens some Holding trades for months is a For a little longer, that is a few months From Laker two years months two years okay my The writing is a bit bad, everyone please adjust. Name of Investment and Investment Your parents must have always understood you. told us that is what let's say for Example: Buy gold, buy gold and get 10 Hold on to anything With the objective that after a few years he Anything that gives a return is called an investment. Similarly, in the stock market also, for a few years to hold something or a share for up to that he will give him the profit later When we talk about investment, we first Learned sculpin okay making all the notes Go ahead and then day trading will come. swing Positional and Investment Or investing is okay, there is another one. that is BTST this is not that much for you guys right now It is not necessary that you are a beginner, this is Buy today sell tomorrow okay a day or two To trade that is BTST, by the way, that It is a little different but I am very I will not go into depth Buy Today Sale Tomorrow is called buy today sell tomorrow Okay, that's BTST trade, now we come. quantitation analysis but okay I The topic of investment came up, so I have explained everything, now it's Quantification.
1 year ago
Pending
The speaker outlines various trading styles: scalping (very short term, minutes), day trading (within the same day), swing trading (days to weeks), positional trading (months), and investment (years). BTST (Buy Today Sell Tomorrow) is also mentioned as a short-term trade.
See the many ways to trade in the market The first method is that trading okay day trading or it Intraday trading is also called second Here comes the swing Trading, then comes positional Trading and one happens The investment is fine and that futures end Put the options aside, it's not about now. are doing and a lot before day trading Sculpin comes to the people from I will tell you all types of trading Let me explain it in this order I'm going to assume you guys are all beginners. Those who know more about the market Not just learning trading I'm sculpin' if you hear me I will tell you the meaning of sculpin Sculpin is very short term The trades take a few minutes for the market to go up. You said goodbye within a few minutes. The market went up, you left, this happened. Sculpin is a 2 minute, 3 minute, 4 minute Trades Trading within minutes Sell Doing by doing this is scalping in it. Make a profit and get out of this sculpin Look, the market is going up, it's going up. You caught a little momentum for 1 minute. I took the trade in and exited, it's over. Done sculpin ok sculpin it which is very short term ok then within a day Buy and sell within the same day For example, you bought an ADAC, okay? Let's take a number like this on 000 I bought it, though it is not of Hajj price but I Just for example, for simplification Bought at 000 1000 becomes 0, as if ₹1 becomes 5 You book a profit of ₹ and exit This is done with day trading, okay then that Swing trading which happens after a few days from a few weeks to from a few Days to weeks is it okay to trade or else Buy and sell anything, any share Selling that is swing trading the most The smaller Sculpin came next. Trading Then Came Swing Trading Swing trading from a few days to a few weeks Till positional trading which happens some Holding trades for months is a For a little longer, that is a few months From Laker two years months two years okay my The writing is a bit bad, everyone please adjust. Name of Investment and Investment Your parents must have always understood you. told us that is what let's say for Example: Buy gold, buy gold and get 10 Hold on to anything With the objective that after a few years he Anything that gives a return is called an investment. Similarly, in the stock market also, for a few years to hold something or a share for up to that he will give him the profit later When we talk about investment, we first Learned sculpin okay making all the notes Go ahead and then day trading will come. swing Positional and Investment Or investing is okay, there is another one. that is BTST this is not that much for you guys right now It is not necessary that you are a beginner, this is Buy today sell tomorrow okay a day or two To trade that is BTST, by the way, that It is a little different but I am very I will not go into depth Buy Today Sale Tomorrow is called buy today sell tomorrow Okay, that's BTST trade, now we come. quantitation analysis but okay I The topic of investment came up, so I have explained everything, now it's Quantification.
Pending
Fundamental analysis involves studying a company's performance, including profits, ownership, goals, reputation, and leadership, and is primarily used for long-term investing.
Fundamental analysis of the company studies fundamentals such as How much profit has the company made? How is the company performing? Who is the owner of the company? Who is the CEO and what are the company's goals? And the reputation and respect of the company, all these things You can trade in the company based on its performance. Or do you invest mostly fundamentally? Analysis is done for investing Well, when you are looking to buy a stock for the long term Fundamentals if you plan to hold The analysis is done
1 year ago
Pending
Fundamental analysis involves studying a company's performance, including profits, ownership, goals, reputation, and leadership, and is primarily used for long-term investing.
Fundamental analysis of the company studies fundamentals such as How much profit has the company made? How is the company performing? Who is the owner of the company? Who is the CEO and what are the company's goals? And the reputation and respect of the company, all these things You can trade in the company based on its performance. Or do you invest mostly fundamentally? Analysis is done for investing Well, when you are looking to buy a stock for the long term Fundamentals if you plan to hold The analysis is done
Pending
Technical analysis involves using tools called indicators, which are displayed as various drawings or filled lines on charts, to analyze the market.
This is the category of indicators ok what are indicators I will explain to you later about indicators basically. tools are there if you guys are a broker Do you use it or are you anywhere else? If you look at the charts, you have read a lot on them. have you ever seen all the different drawings you people You must have seen the video, there are filled lines there. are filled in as if it were a chart like this Okay, it will be filled with something like this. Something will be filled with red, green, blue, yellow, all these It happens that the indicators are correct on their basis to trade or to market on their basis analyzing as well as what our There are technical indicators such as They have a lot of technical tools. Reading the market on a basic basis and Reading the Chart That Is Technical Our analysis comes after that.
1 year ago
Pending
Technical analysis involves using tools called indicators, which are displayed as various drawings or filled lines on charts, to analyze the market.
This is the category of indicators ok what are indicators I will explain to you later about indicators basically. tools are there if you guys are a broker Do you use it or are you anywhere else? If you look at the charts, you have read a lot on them. have you ever seen all the different drawings you people You must have seen the video, there are filled lines there. are filled in as if it were a chart like this Okay, it will be filled with something like this. Something will be filled with red, green, blue, yellow, all these It happens that the indicators are correct on their basis to trade or to market on their basis analyzing as well as what our There are technical indicators such as They have a lot of technical tools. Reading the market on a basic basis and Reading the Chart That Is Technical Our analysis comes after that.
Pending
The four main ways to trade or invest are technical analysis, fundamental analysis, quantitative analysis, and price action analysis, with price action being the primary focus of the course.
I will tell you how to trade in the market Neither to trade nor to invest Four Ways to Do It Right First is technical Analysis Technical Analysis Second E Fundamental Analysis You have to keep a note of everything. Whatever I am saying, whatever I am writing I have to note down all the things along with that. You don't want to mess anything up next Is Quantitation Analysis Look at the analysis spelling that people I don't know the spellings, okay my editor I mess up a lot in quantification Analysis and Law Last Is Price Action analysis which we will do majorly in this course
1 year ago
Pending
The four main ways to trade or invest are technical analysis, fundamental analysis, quantitative analysis, and price action analysis, with price action being the primary focus of the course.
I will tell you how to trade in the market Neither to trade nor to invest Four Ways to Do It Right First is technical Analysis Technical Analysis Second E Fundamental Analysis You have to keep a note of everything. Whatever I am saying, whatever I am writing I have to note down all the things along with that. You don't want to mess anything up next Is Quantitation Analysis Look at the analysis spelling that people I don't know the spellings, okay my editor I mess up a lot in quantification Analysis and Law Last Is Price Action analysis which we will do majorly in this course
Pending
The speaker plans to cover various aspects of price action trading including candlesticks, demand and supply, breakouts, breakdowns, inside bars, volume, and volume divergence.
We are going to learn a lot of things in this. I will tell you some concepts. I have kept all the notes so that we don't forget anything, okay, we are technical in this. Learning a lot from analysis to There are ones like price action proj And what is price action? How do you study price action? What should you use in price action? We have to talk about candlesticks. Understand the psychology of candlesticks In this we will understand about the price movement I will learn about demand and supply. I'll go over breakouts after that. Breakdowns on breakouts and breakdowns How to trade the inside bar Strategizer after that you know us candle will understand the stick in depth then after that Understanding Volume and Volume Divergence
1 year ago
Pending
The speaker plans to cover various aspects of price action trading including candlesticks, demand and supply, breakouts, breakdowns, inside bars, volume, and volume divergence.
We are going to learn a lot of things in this. I will tell you some concepts. I have kept all the notes so that we don't forget anything, okay, we are technical in this. Learning a lot from analysis to There are ones like price action proj And what is price action? How do you study price action? What should you use in price action? We have to talk about candlesticks. Understand the psychology of candlesticks In this we will understand about the price movement I will learn about demand and supply. I'll go over breakouts after that. Breakdowns on breakouts and breakdowns How to trade the inside bar Strategizer after that you know us candle will understand the stick in depth then after that Understanding Volume and Volume Divergence
Pending
The speaker favors 'Exchange' as a Forex broker due to its 15-16 years of market presence and a strong history of successful withdrawals.
personally, my favorite is Exchange because it has been in the market for more than 15-16 years and it has a very good history of withdrawals.
1 year ago
Pending
The speaker favors 'Exchange' as a Forex broker due to its 15-16 years of market presence and a strong history of successful withdrawals.
personally, my favorite is Exchange because it has been in the market for more than 15-16 years and it has a very good history of withdrawals.
Pending
A significant portion of Forex brokers are fraudulent, offering high leverage but withholding withdrawals.
The rest will not give you withdrawals at all. They will give you 500 times margin, 500 times leverage, but there is no withdrawal.
1 year ago
Pending
A significant portion of Forex brokers are fraudulent, offering high leverage but withholding withdrawals.
The rest will not give you withdrawals at all. They will give you 500 times margin, 500 times leverage, but there is no withdrawal.
Pending
While Forex leverage can reach 30:1 (300x), keeping it below 150x allows for good profits with reduced risk.
using leverage, the maximum leverage is 30:1, which means it can be 300 times. But if we keep the leverage below 50, that is, below 150, then also we can book a good profit without risking a lot.
1 year ago
Pending
While Forex leverage can reach 30:1 (300x), keeping it below 150x allows for good profits with reduced risk.
using leverage, the maximum leverage is 30:1, which means it can be 300 times. But if we keep the leverage below 50, that is, below 150, then also we can book a good profit without risking a lot.
Pending
Forex trading offers leverage up to 100x or even 500x.
in forex trading, you get 100x, even 500x leverage.
1 year ago
Pending
Forex trading offers leverage up to 100x or even 500x.
in forex trading, you get 100x, even 500x leverage.
Pending
Forex exhibits double the volatility of stock market futures and options.
we have double the volatility in forex than we have in futures and options.
1 year ago
Pending
Forex exhibits double the volatility of stock market futures and options.
we have double the volatility in forex than we have in futures and options.
Pending
A minimum of ₹1,000,000 is recommended to start trading for earning potential.
start trading with a minimum of 10 or 00 if you want to earn money.
1 year ago
Pending
A minimum of ₹1,000,000 is recommended to start trading for earning potential.
start trading with a minimum of 10 or 00 if you want to earn money.
Pending
The massive volume of the Forex market ($6 trillion daily) makes manipulation nearly impossible.
But when it's $6 trillion, manipulation is close to impossible.
1 year ago
Pending
The massive volume of the Forex market ($6 trillion daily) makes manipulation nearly impossible.
But when it's $6 trillion, manipulation is close to impossible.
Pending
There is a prevailing desire for short-term wealth accumulation over long-term investment in today's market.
But nowadays, no one wants to become rich in the long term. Everyone wants to become rich in the short term.
1 year ago
Pending
There is a prevailing desire for short-term wealth accumulation over long-term investment in today's market.
But nowadays, no one wants to become rich in the long term. Everyone wants to become rich in the short term.
Pending
The stock market is considered better for long-term investment compared to Forex.
for long-term investment, let's assume the stock market is better.
1 year ago
Pending
The stock market is considered better for long-term investment compared to Forex.
for long-term investment, let's assume the stock market is better.
Pending
Despite some legal avenues, Forex trading is ultimately not legal in India.
But in the end, it is not legal in India, and the stock market is 1000% legal at 2000%.
1 year ago
Pending
Despite some legal avenues, Forex trading is ultimately not legal in India.
But in the end, it is not legal in India, and the stock market is 1000% legal at 2000%.
Pending
Minimum of ₹5,000,000 required in a bank account to start trading.
You should have at least ₹5000000 in your bank account only then you should trade
1 year ago
Pending
Minimum of ₹5,000,000 required in a bank account to start trading.
You should have at least ₹5000000 in your bank account only then you should trade
Pending
Indian brokers currently exist that offer legal Forex trading.
And there are Indian brokers who also provide legal trading.
1 year ago
Pending
Indian brokers currently exist that offer legal Forex trading.
And there are Indian brokers who also provide legal trading.
Pending
The creator plans to release more educational trading content in future videos.
I will keep bringing more information with new education in future videos
1 year ago
Pending
The creator plans to release more educational trading content in future videos.
I will keep bringing more information with new education in future videos
Pending
Speaker's strategy involves taking the opposite position of their own trading conviction, claiming this will lead to guaranteed profit and wealth, given their current high loss rate.
take the opposite trade of whatever I think, guaranteed profit, brother, out of my 10, every nine trades are losses, so if I do the exact opposite, then what will happen, no profit, we will become rich
1 year ago
Pending
Speaker's strategy involves taking the opposite position of their own trading conviction, claiming this will lead to guaranteed profit and wealth, given their current high loss rate.
take the opposite trade of whatever I think, guaranteed profit, brother, out of my 10, every nine trades are losses, so if I do the exact opposite, then what will happen, no profit, we will become rich
Pending
Speaker claims to have a foolproof trading strategy that will eliminate future losses.
I have a strategy due to which I will never suffer a loss after this.
1 year ago
Pending
Speaker claims to have a foolproof trading strategy that will eliminate future losses.
I have a strategy due to which I will never suffer a loss after this.
Pending
Funded accounts are presented as another legal method for forex trading in India, with a dedicated video planned for future discussion.
And there's another way to trade Forex legally, that's through funded accounts. Okay, we won't discuss the third method, which is funded accounts, in this video. We will make a completely separate video on it: The Best Legal Way to Trade Forex in India.
1 year ago
Pending
Funded accounts are presented as another legal method for forex trading in India, with a dedicated video planned for future discussion.
And there's another way to trade Forex legally, that's through funded accounts. Okay, we won't discuss the third method, which is funded accounts, in this video. We will make a completely separate video on it: The Best Legal Way to Trade Forex in India.
Pending
As of the transcript's recording, there have been no arrests for forex trading in India, though violating RBI guidelines could potentially lead to such action.
No, if so, has anyone been arrested to date? No, there have been no arrests to date. If you exploit too much and violate some illegal RBI guidelines, there are chances, but it's not 100% sure because no one has been arrested for forex.
1 year ago
Pending
As of the transcript's recording, there have been no arrests for forex trading in India, though violating RBI guidelines could potentially lead to such action.
No, if so, has anyone been arrested to date? No, there have been no arrests to date. If you exploit too much and violate some illegal RBI guidelines, there are chances, but it's not 100% sure because no one has been arrested for forex.
Pending
Failure to pay penalties for illegal forex trading can lead to a non-bailable offense.
And if you are unable to pay the penalty, then you will have to pay a non-bailable penalty. Offense is also considered an offense.
1 year ago
Pending
Failure to pay penalties for illegal forex trading can lead to a non-bailable offense.
And if you are unable to pay the penalty, then you will have to pay a non-bailable penalty. Offense is also considered an offense.
Pending
Penalties for illegal forex trading can include a daily fine of ₹100 and a penalty up to four times the profit generated.
It is as good as ₹100 per day. If you trade even in a single day, you will be fined ₹100. And if you have generated income, for example, you have to pay a penalty of three times four times the profit you have generated. You have to pay four times the penalty.
1 year ago
Pending
Penalties for illegal forex trading can include a daily fine of ₹100 and a penalty up to four times the profit generated.
It is as good as ₹100 per day. If you trade even in a single day, you will be fined ₹100. And if you have generated income, for example, you have to pay a penalty of three times four times the profit you have generated. You have to pay four times the penalty.
Pending
Directly depositing funds from a bank account to a forex broker is highly likely to result in the bank account being frozen.
if you deposit money directly from your bank account into a forex broker, your bank account will be frozen, or it could be. So, keep this in mind: if any foreign broker or forex broker gives you the option to deposit money directly from your bank account, then you should not do that, because your bank account will definitely be frozen, and any money in it will also be frozen.
1 year ago
Pending
Directly depositing funds from a bank account to a forex broker is highly likely to result in the bank account being frozen.
if you deposit money directly from your bank account into a forex broker, your bank account will be frozen, or it could be. So, keep this in mind: if any foreign broker or forex broker gives you the option to deposit money directly from your bank account, then you should not do that, because your bank account will definitely be frozen, and any money in it will also be frozen.
Pending
Buying crypto with Indian Rupees from a bank account and then depositing that crypto into a forex exchange is a loophole that bypasses direct bank transfers and is considered 'totally okay'.
if you buy any crypto from the same Indian bank account and then deposit the crypto into your exchange, then that is totally legal. That is totally okay. That means it is legal. This is a loophole.
1 year ago
Pending
Buying crypto with Indian Rupees from a bank account and then depositing that crypto into a forex exchange is a loophole that bypasses direct bank transfers and is considered 'totally okay'.
if you buy any crypto from the same Indian bank account and then deposit the crypto into your exchange, then that is totally legal. That is totally okay. That means it is legal. This is a loophole.
Pending
Individuals who deposit money directly from their bank accounts to forex brokers risk having their bank accounts frozen, and this risk persists.
in the middle, some people's bank accounts were frozen. Whatever people did, whatever they did, they If they were trading in forex and were depositing money directly from their bank account into a forex broker, for example, their bank accounts were getting frozen. So, this still happens. There are chances that it could happen.
1 year ago
Pending
Individuals who deposit money directly from their bank accounts to forex brokers risk having their bank accounts frozen, and this risk persists.
in the middle, some people's bank accounts were frozen. Whatever people did, whatever they did, they If they were trading in forex and were depositing money directly from their bank account into a forex broker, for example, their bank accounts were getting frozen. So, this still happens. There are chances that it could happen.
Pending
Since crypto has become legal in India in the last 1-2 years, using it as an intermediary for forex transactions is considered a 'jugaadu' but potentially viable method.
But if you are legalizing crypto, which crypto has just become legal. Finally, in the past one or two years, it is moving a little towards a legal method. That is, when crypto has become legal, then putting it in crypto, then you do anything with crypto.
1 year ago
Pending
Since crypto has become legal in India in the last 1-2 years, using it as an intermediary for forex transactions is considered a 'jugaadu' but potentially viable method.
But if you are legalizing crypto, which crypto has just become legal. Finally, in the past one or two years, it is moving a little towards a legal method. That is, when crypto has become legal, then putting it in crypto, then you do anything with crypto.
Pending
A 'jugaadu' method for forex trading involves converting Indian Rupees to cryptocurrency and then converting that cryptocurrency to other forex currencies like USD or EUR.
first exchange the Indian currency into some crypto currency and then we can convert the crypto currency into some other currency, that is, USD forex currency, which is our USD Euro JPY. We can change it in this.
1 year ago
Pending
A 'jugaadu' method for forex trading involves converting Indian Rupees to cryptocurrency and then converting that cryptocurrency to other forex currencies like USD or EUR.
first exchange the Indian currency into some crypto currency and then we can convert the crypto currency into some other currency, that is, USD forex currency, which is our USD Euro JPY. We can change it in this.
Pending
Legal forex brokers in India must be RBI regulated and SEBI registered, offer only 4-5 currency pairs, and these pairs must be related to the Indian Rupee (e.g., USD/INR, EUR/INR).
If your brokers are RBI regulated and SEBI registered, you will be able to trade with those brokers and only four or five options should be visible on them. If you see more than four or five options, then it is not legal. But you know SEBI and RBI. Simply put, all of the currency pairs should be related to Indian Rupees, that is, INR, USD, EUR, JPY, IR. Only then will it be legal.
1 year ago
Pending
Legal forex brokers in India must be RBI regulated and SEBI registered, offer only 4-5 currency pairs, and these pairs must be related to the Indian Rupee (e.g., USD/INR, EUR/INR).
If your brokers are RBI regulated and SEBI registered, you will be able to trade with those brokers and only four or five options should be visible on them. If you see more than four or five options, then it is not legal. But you know SEBI and RBI. Simply put, all of the currency pairs should be related to Indian Rupees, that is, INR, USD, EUR, JPY, IR. Only then will it be legal.
Pending
A broker not appearing on the RBI's list of illegal entities does not automatically mean it is legal for forex trading in India.
if a name is not in this list, it does not mean that it is legal. Well, this means that if the broker's name is not in this list, then it is not legal directly.
1 year ago
Pending
A broker not appearing on the RBI's list of illegal entities does not automatically mean it is legal for forex trading in India.
if a name is not in this list, it does not mean that it is legal. Well, this means that if the broker's name is not in this list, then it is not legal directly.
Pending
Entities on the RBI's alert list are not authorized under FEMA to deal in forex or operate electronic trading platforms, making trading on them illegal.
The alert list contains names of entities which They are neither authorized to deal in forex under the FEMA Act nor authorized to operate electronic trading platforms (ETPs). Trading on these platforms is not allowed under the FEMA Act.
1 year ago
Pending
Entities on the RBI's alert list are not authorized under FEMA to deal in forex or operate electronic trading platforms, making trading on them illegal.
The alert list contains names of entities which They are neither authorized to deal in forex under the FEMA Act nor authorized to operate electronic trading platforms (ETPs). Trading on these platforms is not allowed under the FEMA Act.
Pending
MetaTrader Four and MetaTrader Five are also included in the RBI's list of unauthorized forex trading platforms.
After that, you'll see MetaTrader Four and MetaTrader Five.
1 year ago
Pending
MetaTrader Four and MetaTrader Five are also included in the RBI's list of unauthorized forex trading platforms.
After that, you'll see MetaTrader Four and MetaTrader Five.
Pending
OctaFX is listed as an illegal forex broker in India at number 27 on the RBI's list.
Then there's 4x Octa F, which is at number 27. I thought Octa F was at the top.
1 year ago
Pending
OctaFX is listed as an illegal forex broker in India at number 27 on the RBI's list.
Then there's 4x Octa F, which is at number 27. I thought Octa F was at the top.
Pending
The RBI published a list of 75 illegal forex brokers, including notable names like Alpari, Binance Mo, and Accenture.
the RBI released in an article where there's a list of 75 brokers. Okay, in which there are many names like Alpari. Alpari is a famous broker. I don't know, you guys know it or not. There are names like Binance Mo. Then there's Accenture, which is at number six. That's the first thing to note.
1 year ago
Pending
The RBI published a list of 75 illegal forex brokers, including notable names like Alpari, Binance Mo, and Accenture.
the RBI released in an article where there's a list of 75 brokers. Okay, in which there are many names like Alpari. Alpari is a famous broker. I don't know, you guys know it or not. There are names like Binance Mo. Then there's Accenture, which is at number six. That's the first thing to note.
Pending
A vast majority of forex traders in India (almost 99-100%) use foreign brokers.
99 or even 1 lakh people do whatever they do on foreign brokers only, like exchanges, this or that dim kana, you only know.
1 year ago
Pending
A vast majority of forex traders in India (almost 99-100%) use foreign brokers.
99 or even 1 lakh people do whatever they do on foreign brokers only, like exchanges, this or that dim kana, you only know.
Pending
Indian brokers like Zerodha and Injal One offer forex trading with INR, limited to 4-6 currency pairs such as EUR/INR and USD/INR.
if you go on Zerodha or if you go on Injal One broker, whichever one it is, then if you go there, you will find all the transactions related to INR, that is, in coherence with IR. You will get as many currency pairs as there are, meaning you basically get four to five or six currency pairs, and Major Lire, Euro, EUR, IR, USD, IR, so you get four to five currencies, six currencies.
1 year ago
Pending
Indian brokers like Zerodha and Injal One offer forex trading with INR, limited to 4-6 currency pairs such as EUR/INR and USD/INR.
if you go on Zerodha or if you go on Injal One broker, whichever one it is, then if you go there, you will find all the transactions related to INR, that is, in coherence with IR. You will get as many currency pairs as there are, meaning you basically get four to five or six currency pairs, and Major Lire, Euro, EUR, IR, USD, IR, so you get four to five currencies, six currencies.
Pending
The daily trading volume in the forex market is $6 trillion, significantly exceeding the monthly volume of the stock market.
The volume in forex currency is 6 trillion dollars a day, which is not even the monthly volume of our stock market.
1 year ago
Pending
The daily trading volume in the forex market is $6 trillion, significantly exceeding the monthly volume of the stock market.
The volume in forex currency is 6 trillion dollars a day, which is not even the monthly volume of our stock market.
Pending
There are two primary ways to legally trade forex in India: through Indian brokers offering specific currency pairs, and a 'jugaad' (workaround) method.
Look, there are two legal ways to trade in forex. The first is that you have some Indian brokers who provide you the option to trade in forex currencies in pairs. This is the more legal way. The second is a slightly more jugaad way.
1 year ago
Pending
There are two primary ways to legally trade forex in India: through Indian brokers offering specific currency pairs, and a 'jugaad' (workaround) method.
Look, there are two legal ways to trade in forex. The first is that you have some Indian brokers who provide you the option to trade in forex currencies in pairs. This is the more legal way. The second is a slightly more jugaad way.
Pending
The 1999 Foreign Exchange Management Act (FEMA) prohibits sending Indian money abroad or converting it into other currencies.
The Foreign Exchange Management Act, which came into force in 1999, prohibits ending Indian money outside India, nor sending Indian money outside India, nor can you convert Indian money into any other currency.
1 year ago
Pending
The 1999 Foreign Exchange Management Act (FEMA) prohibits sending Indian money abroad or converting it into other currencies.
The Foreign Exchange Management Act, which came into force in 1999, prohibits ending Indian money outside India, nor sending Indian money outside India, nor can you convert Indian money into any other currency.
Pending
Dedicated six months to studying trading before re-entering the market led to current success.
For six months, I just studied and that's it. When I returned to the market the next time after studying, you know what's happened today.
1 year ago
Pending
Dedicated six months to studying trading before re-entering the market led to current success.
For six months, I just studied and that's it. When I returned to the market the next time after studying, you know what's happened today.
Pending
Violating RBI policies in forex trading can lead to jail time and is considered a non-bailable offense.
if you violate the policies of RBI then you can be jailed and it is a non-bailable offence.
1 year ago
Pending
Violating RBI policies in forex trading can lead to jail time and is considered a non-bailable offense.
if you violate the policies of RBI then you can be jailed and it is a non-bailable offence.
Pending
The speaker incurred a loan of 2-4 lakh rupees by the age of 18 due to trading losses.
I was in a loan of ₹2 to ₹4 lakh. And that too at the age of 18. ... I was already sitting on a loan that I had lost in trading.
1 year ago
Pending
The speaker incurred a loan of 2-4 lakh rupees by the age of 18 due to trading losses.
I was in a loan of ₹2 to ₹4 lakh. And that too at the age of 18. ... I was already sitting on a loan that I had lost in trading.
Pending
Learning trading can lead to significant success.
if you learn trading, it can definitely take you to the top.
1 year ago
Pending
Learning trading can lead to significant success.
if you learn trading, it can definitely take you to the top.
Pending
The RBI released a list on November 24, 2023, identifying 75 illegal forex brokers in India, including popular ones like Axis, OctaFX, and MetaTrader 4.
They established a list on November 24, 2023. In which they have listed a total of 75 brokers which are not legal for Forex trading in India and it includes all your favorite brokers whether it is Axis or OctaFX or even MetaTrader 4.
1 year ago
Pending
The RBI released a list on November 24, 2023, identifying 75 illegal forex brokers in India, including popular ones like Axis, OctaFX, and MetaTrader 4.
They established a list on November 24, 2023. In which they have listed a total of 75 brokers which are not legal for Forex trading in India and it includes all your favorite brokers whether it is Axis or OctaFX or even MetaTrader 4.
Pending
A recommended learning sequence for trading education is: candlestick trading, then chart patterns, followed by intraday or options trading.
First, you have to go to the candlestick trading course. After completing the candlestick trading course, you have to go to the chart pattern trading course. Once that is complete, you can trade in both intraday and options. You can do any one of these. First, take the candlestick trading course, then the chart pattern trading course, then the options trading course or the intraday trading course.
1 year ago
Pending
A recommended learning sequence for trading education is: candlestick trading, then chart patterns, followed by intraday or options trading.
First, you have to go to the candlestick trading course. After completing the candlestick trading course, you have to go to the chart pattern trading course. Once that is complete, you can trade in both intraday and options. You can do any one of these. First, take the candlestick trading course, then the chart pattern trading course, then the options trading course or the intraday trading course.
Pending
Forex trading has been illegal in India for the past 25 years (1999-2024).
forex trading has not been legal in India in the last 25 years, from 1999 till 2024.
1 year ago
Pending
Forex trading has been illegal in India for the past 25 years (1999-2024).
forex trading has not been legal in India in the last 25 years, from 1999 till 2024.
Pending
Forex trading is not legal in India, and the video will explain the nuances of legal trading, illegality, and related aspects.
forex trading is not legal in India. Now this has given the answer. Now, we will understand whether it is legal in India or not. What is legal? How can you trade legally? Why is it illegal? We will learn all these things in this video.
1 year ago
Pending
Forex trading is not legal in India, and the video will explain the nuances of legal trading, illegality, and related aspects.
forex trading is not legal in India. Now this has given the answer. Now, we will understand whether it is legal in India or not. What is legal? How can you trade legally? Why is it illegal? We will learn all these things in this video.
Pending
A 4-hour price action trading course will be released the day after this video.
I'm going to record a 4-hour continuous price action trading course for you, just after the exact moment of this video. As soon as this video is released, that video will be released the next day.
1 year ago
Pending
A 4-hour price action trading course will be released the day after this video.
I'm going to record a 4-hour continuous price action trading course for you, just after the exact moment of this video. As soon as this video is released, that video will be released the next day.
Pending
Traders should exclusively use candlestick charts and avoid trading with line charts.
If you see such a chart, you should not trade there. You should always use only the candlestick chart.
1 year ago
Pending
Traders should exclusively use candlestick charts and avoid trading with line charts.
If you see such a chart, you should not trade there. You should always use only the candlestick chart.
Pending
The creator may create a free forex trading course in the future.
And maybe I will also create a free forex trading course.
1 year ago
Pending
The creator may create a free forex trading course in the future.
And maybe I will also create a free forex trading course.
Pending
Paper trading can provide valuable experience in understanding market dynamics and chart movements.
You can gain market experience through paper trading, how the market works, how the chart goes up, how the chart goes down.
1 year ago
Pending
Paper trading can provide valuable experience in understanding market dynamics and chart movements.
You can gain market experience through paper trading, how the market works, how the chart goes up, how the chart goes down.
Pending
If the price of INR increases, the USD/INR chart will go down.
If the price of IR increases, then the chart of USD IR will go down.
1 year ago
Pending
If the price of INR increases, the USD/INR chart will go down.
If the price of IR increases, then the chart of USD IR will go down.
Pending
Paper trading is defined as practicing trading with virtual money.
paper trading means trading with fake money
1 year ago
Pending
Paper trading is defined as practicing trading with virtual money.
paper trading means trading with fake money
Pending
If the price of INR falls, the USD/INR chart will move higher.
If the price of IR falls, then what will happen in the chart of USD IR. What will happen in the chart of USD IR is that the chart will move higher because the price of IR has fallen now.
1 year ago
Pending
If the price of INR falls, the USD/INR chart will move higher.
If the price of IR falls, then what will happen in the chart of USD IR. What will happen in the chart of USD IR is that the chart will move higher because the price of IR has fallen now.
Pending
Individuals should only apply for funded accounts if they possess confidence, substantial knowledge, and have engaged in backtesting trading strategies for several months or years.
So, if you have confidence and a good amount of knowledge, and have backtested for a few months or a few years, only then should you apply for a funded account.
1 year ago
Pending
Individuals should only apply for funded accounts if they possess confidence, substantial knowledge, and have engaged in backtesting trading strategies for several months or years.
So, if you have confidence and a good amount of knowledge, and have backtested for a few months or a few years, only then should you apply for a funded account.
Pending
Under 18s may lack the necessary money psychology and maturity for trading due to not having earned money themselves.
you have n't yet developed that psychology and that maturity, especially with money. Because you have n't earned any money yet, so that psychology, which is money psychology, doesn't develop properly.
1 year ago
Pending
Under 18s may lack the necessary money psychology and maturity for trading due to not having earned money themselves.
you have n't yet developed that psychology and that maturity, especially with money. Because you have n't earned any money yet, so that psychology, which is money psychology, doesn't develop properly.
Pending
There is a fee to take the funded account exam, ranging from $50-$100 for a $5,000 account, or approximately ₹10,000-₹12,000. This fee is non-refundable, and failure to pass the exam results in the loss of this amount. The company profits from both exam fees and from the successful traders.
Right now, if you want a funded account of $5,000, you have to pay around $100 to $50, which is $10,000 to $ 10,000. Then, when you clear the test, the company benefits in two ways. Suppose 10 people are taking the exam, all 10 won't clear it. Nine out of 10 will fail. One person will clear it. So, the company is earning money in two ways. The xam fees for those who fail also go to the company. exam fees for those who fail also go to the company. And the profit from the one who passes also goes to the company. A portion of the money earned will go to the company. So, the company is making a profit with everything. The company has to make a profit on everything. Okay, you have to keep one thing in mind: a funded account isn't just a child's play. Okay, you know trading and you have the confidence to go and clear the funded account and clear its exam. Only then should you go after a funded account. 10,000 to 12,000 isn't a small amount for us. 10,000 to 12,000 is not a small amount. If you pay 10,000 to 12,000 if you pass the exam, you'll get the account. Even after that, you'll have to make a profit on the account only then will you get anything. If you fail the exam, you'll lose all your money. You won't get a refund. There's no refund. So, if 10 people apply for the exam and fail, your money is gone.
1 year ago
Pending
There is a fee to take the funded account exam, ranging from $50-$100 for a $5,000 account, or approximately ₹10,000-₹12,000. This fee is non-refundable, and failure to pass the exam results in the loss of this amount. The company profits from both exam fees and from the successful traders.
Right now, if you want a funded account of $5,000, you have to pay around $100 to $50, which is $10,000 to $ 10,000. Then, when you clear the test, the company benefits in two ways. Suppose 10 people are taking the exam, all 10 won't clear it. Nine out of 10 will fail. One person will clear it. So, the company is earning money in two ways. The xam fees for those who fail also go to the company. exam fees for those who fail also go to the company. And the profit from the one who passes also goes to the company. A portion of the money earned will go to the company. So, the company is making a profit with everything. The company has to make a profit on everything. Okay, you have to keep one thing in mind: a funded account isn't just a child's play. Okay, you know trading and you have the confidence to go and clear the funded account and clear its exam. Only then should you go after a funded account. 10,000 to 12,000 isn't a small amount for us. 10,000 to 12,000 is not a small amount. If you pay 10,000 to 12,000 if you pass the exam, you'll get the account. Even after that, you'll have to make a profit on the account only then will you get anything. If you fail the exam, you'll lose all your money. You won't get a refund. There's no refund. So, if 10 people apply for the exam and fail, your money is gone.
Pending
The key indicator of a good trader for funded account evaluation is profit. Achieving a 5% profit target in the exam, while seemingly simple to explain, is described as very difficult in practice.
The identity of a good trader is profit, right? Profit, money. So, if you show the company that you have made a profit twice on the demo account, but remember, there are many complications in this. This is easy to explain, but making that profit is very difficult. Making a profit on 5 is no joke.
1 year ago
Pending
The key indicator of a good trader for funded account evaluation is profit. Achieving a 5% profit target in the exam, while seemingly simple to explain, is described as very difficult in practice.
The identity of a good trader is profit, right? Profit, money. So, if you show the company that you have made a profit twice on the demo account, but remember, there are many complications in this. This is easy to explain, but making that profit is very difficult. Making a profit on 5 is no joke.
Pending
The speaker suggests a minimum savings amount (represented by '0,000', '1,000,000', '0,000', and '2,000') is needed to start trading, with flexibility in the amount.
you need to save at least ₹0,000. If you want to start with ₹1,000,000, you can definitely do it. If you want to start with ₹0,000, you can definitely do it. If you want to start with ₹2,000, you can definitely do it.
1 year ago
Pending
The speaker suggests a minimum savings amount (represented by '0,000', '1,000,000', '0,000', and '2,000') is needed to start trading, with flexibility in the amount.
you need to save at least ₹0,000. If you want to start with ₹1,000,000, you can definitely do it. If you want to start with ₹0,000, you can definitely do it. If you want to start with ₹2,000, you can definitely do it.
Pending
The speaker guarantees the listener will memorize all candlestick patterns by following their suggested method within a few days.
If you don't memorize them, then change my name brother.
1 year ago
Pending
The speaker guarantees the listener will memorize all candlestick patterns by following their suggested method within a few days.
If you don't memorize them, then change my name brother.
Pending
Even experienced traders can experience their capital becoming zero at some point.
your capital will become zero at some point or the other, no matter how much you work on psychology, how much you learn trading, what happens is that with time, with experience, you get better and you don't let it become zero, but sometimes it becomes zero
1 year ago
Pending
Even experienced traders can experience their capital becoming zero at some point.
your capital will become zero at some point or the other, no matter how much you work on psychology, how much you learn trading, what happens is that with time, with experience, you get better and you don't let it become zero, but sometimes it becomes zero
Pending
The funded account exam consists of two steps conducted on a demo account. Candidates must demonstrate a 5% profit in the first step and another 5% profit in the second step to be awarded a funded account.
Now, that exam is n't very difficult, but it takes two steps. I'll explain those two steps to you in detail. Let's say you have a funded account of $55,000. If you want that funded account, you will have to show that you can make a profit of 5% on that funded account. Okay, and they won't give you a funded account directly. They will first give you a demo account. When you make 5% profit the first time, you will clear the first step, then the second. You will have to create the same amount of 5 on the same demo account. When you combine both to 10, you will be given an actual funded account and you will be able to trade with the actual fund.
1 year ago
Pending
The funded account exam consists of two steps conducted on a demo account. Candidates must demonstrate a 5% profit in the first step and another 5% profit in the second step to be awarded a funded account.
Now, that exam is n't very difficult, but it takes two steps. I'll explain those two steps to you in detail. Let's say you have a funded account of $55,000. If you want that funded account, you will have to show that you can make a profit of 5% on that funded account. Okay, and they won't give you a funded account directly. They will first give you a demo account. When you make 5% profit the first time, you will clear the first step, then the second. You will have to create the same amount of 5 on the same demo account. When you combine both to 10, you will be given an actual funded account and you will be able to trade with the actual fund.
Pending
It is recommended to gain 1-2 years of experience before making significant decisions like quitting a job to trade.
Gain a year or two of experience, and then see.
1 year ago
Pending
It is recommended to gain 1-2 years of experience before making significant decisions like quitting a job to trade.
Gain a year or two of experience, and then see.
Pending
Funded accounts offer a legal and relatively safe way to trade Forex in India. This involves trading with money provided by a firm, where traders are essentially employees who make profits and receive a percentage, while the firm retains the rest. To obtain a funded account, traders must pass an exam.
The third method, which is the safest and easiest, is funded accounts. Funded accounts have a very simple principle. Let's explain with an example. Funded accounts are basically you're trading with someone else's money and making money and giving it to them, and you're keeping a percentage of it. Okay, so let's assume that there are 10 people in the US who have invested money in a firm called XY. They told us that after making a small profit, what will the company do? The company wo n't do the hard work itself. The company will find different good traders and give them small amounts of that money. And those people will invest in that money. They will make a profit and give it to you. Okay, traders are traders, and those traders will be us and you. Basically, what will happen is that the company will give you money to trade, and those traders are trading with that money, and you and I become traders. We are called funded traders who will trade with their money. But there's a catch: they wo n't give you that money directly because you have to prove yourself as a good trader. So, how will you do that? The company conducts an exam. Only when you clear that exam will you get a funded account.
1 year ago
Pending
Funded accounts offer a legal and relatively safe way to trade Forex in India. This involves trading with money provided by a firm, where traders are essentially employees who make profits and receive a percentage, while the firm retains the rest. To obtain a funded account, traders must pass an exam.
The third method, which is the safest and easiest, is funded accounts. Funded accounts have a very simple principle. Let's explain with an example. Funded accounts are basically you're trading with someone else's money and making money and giving it to them, and you're keeping a percentage of it. Okay, so let's assume that there are 10 people in the US who have invested money in a firm called XY. They told us that after making a small profit, what will the company do? The company wo n't do the hard work itself. The company will find different good traders and give them small amounts of that money. And those people will invest in that money. They will make a profit and give it to you. Okay, traders are traders, and those traders will be us and you. Basically, what will happen is that the company will give you money to trade, and those traders are trading with that money, and you and I become traders. We are called funded traders who will trade with their money. But there's a catch: they wo n't give you that money directly because you have to prove yourself as a good trader. So, how will you do that? The company conducts an exam. Only when you clear that exam will you get a funded account.
Pending
To make money in trading, an initial investment is required, and it's not possible to trade effectively with zero capital.
if you want to earn money in trading, you will also have to invest money. It's not like once you invest $0,000, it's there.
1 year ago
Pending
To make money in trading, an initial investment is required, and it's not possible to trade effectively with zero capital.
if you want to earn money in trading, you will also have to invest money. It's not like once you invest $0,000, it's there.
Pending
Directly transferring money from an Indian bank account to a Forex broker outside India is a violation of the FEMA Act and can lead to severe consequences, including bank account freezing, fund seizure, and fines of up to three to four times the profits not made.
As discussed earlier, the RBI is not infallible; they know everything. If you make any transaction directly from your bank account, outside India or in any other currency, with a forex broker, your bank account can also be frozen. Tell me what all can happen. If I am a debt person and I do not use crypto, I say no, I will deposit money only from my bank account. What can happen to my forex broker? Your bank account can be frozen. Your funds can be stopped. And another thing that can happen is that you can also be fined. You can also be fined because you are regulating and violating the FEMA Act. You can also be fined and you can have to pay three to four times more than the profit you are not making as a penalty. Okay, so keep this in mind that all the people who trade in forex, if they deposit money directly from their bank accounts, then look, brother, even your bank account has been frozen once. It was just because I deposited money directly, and some of my friends' bank accounts have also been frozen for $0.000. So don't think that if I deposit a small amount directly, nothing will happen. Depositing money directly from a bank account into a forex broker directly violates the FIMA Act.
1 year ago
Pending
Directly transferring money from an Indian bank account to a Forex broker outside India is a violation of the FEMA Act and can lead to severe consequences, including bank account freezing, fund seizure, and fines of up to three to four times the profits not made.
As discussed earlier, the RBI is not infallible; they know everything. If you make any transaction directly from your bank account, outside India or in any other currency, with a forex broker, your bank account can also be frozen. Tell me what all can happen. If I am a debt person and I do not use crypto, I say no, I will deposit money only from my bank account. What can happen to my forex broker? Your bank account can be frozen. Your funds can be stopped. And another thing that can happen is that you can also be fined. You can also be fined because you are regulating and violating the FEMA Act. You can also be fined and you can have to pay three to four times more than the profit you are not making as a penalty. Okay, so keep this in mind that all the people who trade in forex, if they deposit money directly from their bank accounts, then look, brother, even your bank account has been frozen once. It was just because I deposited money directly, and some of my friends' bank accounts have also been frozen for $0.000. So don't think that if I deposit a small amount directly, nothing will happen. Depositing money directly from a bank account into a forex broker directly violates the FIMA Act.
Pending
Forex trading can be conducted legally in India by using cryptocurrency as an intermediary. This method bypasses direct conversion of INR to foreign currency, which is restricted by FEMA. Crypto is considered mostly legal in India after the imposition of taxes, and its decentralized nature means transactions are not easily tracked by any single country or authority. Users can convert INR to crypto, then use crypto to fund a Forex trading account.
the second method will be a little trickery. The third method will be even trickier. So, stay tuned for the video. Let's start with the first method. Before that, just take a minute. I'll turn on screen recording and give you the list. You'll find the link on the RBI website in the description if you want to check it out. According to the FEMA Act, all these brokers are not legal. Octa, for example, Accenture, Banam, Alpari, all these brokers are not legal. Now let's talk about the methods to trade forex legally. Let's start with method number one. The most legal, the most correct method, you tell me, brother. First, it is absolutely legal. Our Indian brokers, the SEBI-registered brokers, give you four to six currency pairs that you can legally trade in Indian Rupees. Okay, but the catch is that all the currency pairs are related only to IR, so only four or six options are available. Okay, even in those, you can trade only with IR. See what most people like to trade. What do you like? UD, EUR, JPY, currencies with very high volume. There is no option at all, that is what you mean to say, these are not options and how many options do you have in forex, well if we talk about the variety of options, there are hundreds of options, there are commodities too, there are oils, that means there are 3 or 50 such options, many people get confused, they think that forex trading involves only currencies, so one thing I would like to request you guys is that no one provides so much hard work and so much education for free, in return I will just ask for a subscribe and a like, nothing else, please support and I will keep bringing such educational videos for you for free, thank you so much guys, but you need to know that forex trading started only with currencies, after that some other options also came in it like commodities came, oil etc. came, okay, so you can trade in all these options in forex trading, which is the first legal way, he said, in this Indian brokers like I Guess Angel I also searched on One and saw that there is also Roda P. Okay, if you search for something like IR USD there, you will get a couple of options, so you can trade on them. Tell me its disadvantages. Its disadvantage is that it does not have much volume, there is not much liquidity because on the other hand, volume and liquidity. Please explain to the audience that volume means how many people are trading on that currency pair globally. Okay, look, if we go for the forex market, if we talk about the forex market, the forex market is the biggest financial market in the whole world. Okay, okay, and its overall daily volume is $ trillion, its exchanges. Now, volume means a daily volume of $6 trillion. This means that there is a daily buy and sell of $6 trillion. Okay, the simple meaning of volume is how much buying and selling is happening, how much trading is happening. Okay, now if we talk about Indian markets, even in a whole week, it does not amount to one day. That is why people trade forex because the movement is very fast. The profits and losses are also faster. Now, the first method of trading with Indian brokers. You said there's no volume, which means there won't be much movement. Usually, if we talk about forex pairs, there are seven to eight currency pairs that the majority of people trade. There's a daily up-and-down movement of 1 to 2 pence. But if you talk about currency pairs related to the Indian rupee, there's very little movement. It's simple. If you only get four or five forex options with Indian brokers, instead of that, you should trade in Nifty. Brother, do one thing. Trade in the Indian market, where you have options on thousands of companies. Trade equities there, or do FAO. Do whatever you want. Okay, it would be better. More than just four or five options where there's no volume. There's no volume, which means there won't be much ups and downs. That means there won't be much profit or loss. There won't be any profit or loss. This is the first method, which is the most legal. And this is the most correct method, but now we will come to the jugaadu methods in which you actually trade in forex. Right now this is just forex in name, there are four options, not forex trading. Now we will learn two methods of proper forex trading. Now look directly all over to you. The second method is exploiting the loopholes. Look, FEM says that you cannot exchange Indian currency into any other currency, but what if we take a broker, that is, take an intermediary, and we buy something from that intermediary. Okay, not an Apple, evolving a third party. Okay, now let me give you an example. Even if you go to rent out a flat, you do not get it directly. You go to a broker, the broker finds it for you. The broker is your mediator, and in this process, your mediator will be crypto. Okay, suppose I buy crypto with Indian Rupees and buy another currency pair with crypto. Okay, so FEM says that you cannot exchange Indian Rupees directly into any other currency. Meaning you cannot convert IR into dollars, you cannot convert IR into pounds, so in simple words, first we are adopting Rupees, then whatever we want to do with crypto is our wish, so this is their way of saying, crypto is the mediator and we can do it by using crypto, and to tell you in a little detail, see further, crypto is decentralized market, before this when FEMA Act came and the invention of crypto, that is, the invention may have happened, the first thing is is crypto legal now, yes, okay, so one thing I would like to request you guys is that no ne provides so much hard work and so much education for free, in one provides so much hard work and so much education for free, in return I will just ask for a subscribe and a like from you, nothing else, please support and I will keep bringing such educational videos for you for free, thank you so much guy, so there is taxation also and in India, even though it was not considered legal till 2 years ago, but after the imposition of taxation, it is, I mean, legal on 60-70 percent, mostly legal Actually, crypto has already been legalized, in a way, now look, Binance was banned, Binance is back, what does it mean to be back, it means the government is accepting it, right? It is legal, Binance was banned, Binance is back, with it WazirX, all this is going on, right? It means mostly it is legal, on top of that they are charging you tax on 30%, they are charging tax on capital gains, now crypto currency has been legalized, so we are converting Indian Rupees into crypto in a legal way, then we can do whatever we want with crypto, be it forex trading, now tell me about the decentralized wallet, see, crypto is a decentralized market where if we talk about Indian Rupees, Indian Rupees is regulated by RBI and if RBI has complete track, but if we talk about crypto, then no country can track it, it is a decentralized market, meaning it has no boss, in a way it has become cash in a way So, suppose you buy any crypto with your Indian Rupee, then the government has no right to know where it went, it doesn't even have any track, okay, decentralized means that there is no track of it, okay, neither you, I mean anyone else knows, third person, no one will know what you have done, right, exactly, so this is about a decentralized market, if it is decentralized then it has no boss, because of the absence of a boss, we can legally trade crypto globally, so if we buy crypto with that, that is, we buy any other currency with crypto, that is totally, then what will we do, if we want to deposit money in any exchange, then we may first create an account, but after creating the account, we will not transfer it directly from the bank account, we will first buy crypto on any exchange, let's say Bitcoin or Binance, and then from there you deposit the money in your exchange where you have a forex trading account, from there you can deposit your money in your You will also be able to trade currency pairs legally.
1 year ago
Pending
Forex trading can be conducted legally in India by using cryptocurrency as an intermediary. This method bypasses direct conversion of INR to foreign currency, which is restricted by FEMA. Crypto is considered mostly legal in India after the imposition of taxes, and its decentralized nature means transactions are not easily tracked by any single country or authority. Users can convert INR to crypto, then use crypto to fund a Forex trading account.
the second method will be a little trickery. The third method will be even trickier. So, stay tuned for the video. Let's start with the first method. Before that, just take a minute. I'll turn on screen recording and give you the list. You'll find the link on the RBI website in the description if you want to check it out. According to the FEMA Act, all these brokers are not legal. Octa, for example, Accenture, Banam, Alpari, all these brokers are not legal. Now let's talk about the methods to trade forex legally. Let's start with method number one. The most legal, the most correct method, you tell me, brother. First, it is absolutely legal. Our Indian brokers, the SEBI-registered brokers, give you four to six currency pairs that you can legally trade in Indian Rupees. Okay, but the catch is that all the currency pairs are related only to IR, so only four or six options are available. Okay, even in those, you can trade only with IR. See what most people like to trade. What do you like? UD, EUR, JPY, currencies with very high volume. There is no option at all, that is what you mean to say, these are not options and how many options do you have in forex, well if we talk about the variety of options, there are hundreds of options, there are commodities too, there are oils, that means there are 3 or 50 such options, many people get confused, they think that forex trading involves only currencies, so one thing I would like to request you guys is that no one provides so much hard work and so much education for free, in return I will just ask for a subscribe and a like, nothing else, please support and I will keep bringing such educational videos for you for free, thank you so much guys, but you need to know that forex trading started only with currencies, after that some other options also came in it like commodities came, oil etc. came, okay, so you can trade in all these options in forex trading, which is the first legal way, he said, in this Indian brokers like I Guess Angel I also searched on One and saw that there is also Roda P. Okay, if you search for something like IR USD there, you will get a couple of options, so you can trade on them. Tell me its disadvantages. Its disadvantage is that it does not have much volume, there is not much liquidity because on the other hand, volume and liquidity. Please explain to the audience that volume means how many people are trading on that currency pair globally. Okay, look, if we go for the forex market, if we talk about the forex market, the forex market is the biggest financial market in the whole world. Okay, okay, and its overall daily volume is $ trillion, its exchanges. Now, volume means a daily volume of $6 trillion. This means that there is a daily buy and sell of $6 trillion. Okay, the simple meaning of volume is how much buying and selling is happening, how much trading is happening. Okay, now if we talk about Indian markets, even in a whole week, it does not amount to one day. That is why people trade forex because the movement is very fast. The profits and losses are also faster. Now, the first method of trading with Indian brokers. You said there's no volume, which means there won't be much movement. Usually, if we talk about forex pairs, there are seven to eight currency pairs that the majority of people trade. There's a daily up-and-down movement of 1 to 2 pence. But if you talk about currency pairs related to the Indian rupee, there's very little movement. It's simple. If you only get four or five forex options with Indian brokers, instead of that, you should trade in Nifty. Brother, do one thing. Trade in the Indian market, where you have options on thousands of companies. Trade equities there, or do FAO. Do whatever you want. Okay, it would be better. More than just four or five options where there's no volume. There's no volume, which means there won't be much ups and downs. That means there won't be much profit or loss. There won't be any profit or loss. This is the first method, which is the most legal. And this is the most correct method, but now we will come to the jugaadu methods in which you actually trade in forex. Right now this is just forex in name, there are four options, not forex trading. Now we will learn two methods of proper forex trading. Now look directly all over to you. The second method is exploiting the loopholes. Look, FEM says that you cannot exchange Indian currency into any other currency, but what if we take a broker, that is, take an intermediary, and we buy something from that intermediary. Okay, not an Apple, evolving a third party. Okay, now let me give you an example. Even if you go to rent out a flat, you do not get it directly. You go to a broker, the broker finds it for you. The broker is your mediator, and in this process, your mediator will be crypto. Okay, suppose I buy crypto with Indian Rupees and buy another currency pair with crypto. Okay, so FEM says that you cannot exchange Indian Rupees directly into any other currency. Meaning you cannot convert IR into dollars, you cannot convert IR into pounds, so in simple words, first we are adopting Rupees, then whatever we want to do with crypto is our wish, so this is their way of saying, crypto is the mediator and we can do it by using crypto, and to tell you in a little detail, see further, crypto is decentralized market, before this when FEMA Act came and the invention of crypto, that is, the invention may have happened, the first thing is is crypto legal now, yes, okay, so one thing I would like to request you guys is that no ne provides so much hard work and so much education for free, in one provides so much hard work and so much education for free, in return I will just ask for a subscribe and a like from you, nothing else, please support and I will keep bringing such educational videos for you for free, thank you so much guy, so there is taxation also and in India, even though it was not considered legal till 2 years ago, but after the imposition of taxation, it is, I mean, legal on 60-70 percent, mostly legal Actually, crypto has already been legalized, in a way, now look, Binance was banned, Binance is back, what does it mean to be back, it means the government is accepting it, right? It is legal, Binance was banned, Binance is back, with it WazirX, all this is going on, right? It means mostly it is legal, on top of that they are charging you tax on 30%, they are charging tax on capital gains, now crypto currency has been legalized, so we are converting Indian Rupees into crypto in a legal way, then we can do whatever we want with crypto, be it forex trading, now tell me about the decentralized wallet, see, crypto is a decentralized market where if we talk about Indian Rupees, Indian Rupees is regulated by RBI and if RBI has complete track, but if we talk about crypto, then no country can track it, it is a decentralized market, meaning it has no boss, in a way it has become cash in a way So, suppose you buy any crypto with your Indian Rupee, then the government has no right to know where it went, it doesn't even have any track, okay, decentralized means that there is no track of it, okay, neither you, I mean anyone else knows, third person, no one will know what you have done, right, exactly, so this is about a decentralized market, if it is decentralized then it has no boss, because of the absence of a boss, we can legally trade crypto globally, so if we buy crypto with that, that is, we buy any other currency with crypto, that is totally, then what will we do, if we want to deposit money in any exchange, then we may first create an account, but after creating the account, we will not transfer it directly from the bank account, we will first buy crypto on any exchange, let's say Bitcoin or Binance, and then from there you deposit the money in your exchange where you have a forex trading account, from there you can deposit your money in your You will also be able to trade currency pairs legally.
Pending
The speaker differentiates trading from investment, implying distinct strategies and outcomes for each.
trading is different and investment is different
1 year ago
Pending
The speaker differentiates trading from investment, implying distinct strategies and outcomes for each.
trading is different and investment is different
Pending
The Forex market is the largest financial market globally, with a daily trading volume of $6 trillion.
if we talk about the forex market, the forex market is the biggest financial market in the whole world. Okay, okay, and its overall daily volume is $ trillion, its exchanges.
1 year ago
Pending
The Forex market is the largest financial market globally, with a daily trading volume of $6 trillion.
if we talk about the forex market, the forex market is the biggest financial market in the whole world. Okay, okay, and its overall daily volume is $ trillion, its exchanges.
Pending
New traders should not expect quick profits and are likely to experience significant losses in their first year of trading.
There will be no quick profits in trading. Even if you do, by mistake you make profits in the first month, second month, third month. They should not last long. You will incur major losses in the first year.
1 year ago
Pending
New traders should not expect quick profits and are likely to experience significant losses in their first year of trading.
There will be no quick profits in trading. Even if you do, by mistake you make profits in the first month, second month, third month. They should not last long. You will incur major losses in the first year.
Pending
SEBI-registered Indian brokers offer limited Forex trading options, primarily four to six currency pairs exclusively with the Indian Rupee.
Our Indian brokers, the SEBI-registered brokers, give you four to six currency pairs that you can legally trade in Indian Rupees. Okay, but the catch is that all the currency pairs are related only to IR, so only four or six options are available.
1 year ago
Pending
SEBI-registered Indian brokers offer limited Forex trading options, primarily four to six currency pairs exclusively with the Indian Rupee.
Our Indian brokers, the SEBI-registered brokers, give you four to six currency pairs that you can legally trade in Indian Rupees. Okay, but the catch is that all the currency pairs are related only to IR, so only four or six options are available.
Pending
The RBI has declared certain Forex brokers illegal in India. The video will outline three legal methods for Forex trading in India.
The RBI has listed them all as illegal brokers. Now, in this video, we'll discuss the ways to trade Forex legally in India. There are three ways.
1 year ago
Pending
The RBI has declared certain Forex brokers illegal in India. The video will outline three legal methods for Forex trading in India.
The RBI has listed them all as illegal brokers. Now, in this video, we'll discuss the ways to trade Forex legally in India. There are three ways.
Pending
Smaller time frames tend to produce more fake signals. For example, a morning star pattern on a smaller time frame might be contradicted by the market's actual movement on a slightly larger time frame.
because the smaller the timeframe, the more fake signals you get. It could be that the evening star may give you a fake signal, or the morning star, sorry, the morning star may give you a fake signal, saying, no, brother, it told you that it will go up, but you are watching in 5 minutes, the market is continuously falling, but in 9 minutes you see a morning star, so you have to avoid this trap.
1 year ago
Pending
Smaller time frames tend to produce more fake signals. For example, a morning star pattern on a smaller time frame might be contradicted by the market's actual movement on a slightly larger time frame.
because the smaller the timeframe, the more fake signals you get. It could be that the evening star may give you a fake signal, or the morning star, sorry, the morning star may give you a fake signal, saying, no, brother, it told you that it will go up, but you are watching in 5 minutes, the market is continuously falling, but in 9 minutes you see a morning star, so you have to avoid this trap.
Pending
For high conviction intraday trades, it's beneficial to have analysis align across three timeframes: 1 minute, 15 minutes, and 1 hour. The primary analysis should be on 15 minutes, with confirmation on the trading timeframe (e.g., 1 or 5 minutes) and a glance at the 1-hour for broader context.
What will happen if you are going to make a mistake? Even in the long term, if you see that your analysis is correct, then you will tick three times. That means you will tick on 1 minute, you will tick on 15 minutes and you will also tick on One R. In this way, your multi-time frame analysis will be done. But One R is no less compulsory. Just go and glance once. You have to analyze majorly on two time frames. If you are going to trade on 15 minutes, directly using the 15-minute time frame, then that is good. If you are going to trade on 5 minutes or 1-minute candles, then you still have to do the 15-minute analysis. And after that, on whichever time frame you are trading, You need to take the trade at the time frame you're going to trade.
1 year ago
Pending
For high conviction intraday trades, it's beneficial to have analysis align across three timeframes: 1 minute, 15 minutes, and 1 hour. The primary analysis should be on 15 minutes, with confirmation on the trading timeframe (e.g., 1 or 5 minutes) and a glance at the 1-hour for broader context.
What will happen if you are going to make a mistake? Even in the long term, if you see that your analysis is correct, then you will tick three times. That means you will tick on 1 minute, you will tick on 15 minutes and you will also tick on One R. In this way, your multi-time frame analysis will be done. But One R is no less compulsory. Just go and glance once. You have to analyze majorly on two time frames. If you are going to trade on 15 minutes, directly using the 15-minute time frame, then that is good. If you are going to trade on 5 minutes or 1-minute candles, then you still have to do the 15-minute analysis. And after that, on whichever time frame you are trading, You need to take the trade at the time frame you're going to trade.
Pending
For BTST, intraday, and options trading, both 5-minute and 15-minute time frames can be used, requiring some trial and error to determine personal preference.
So, for BTST intraday and for many people, options trading, but if you do options trading, you have to pay a little attention. You can do 5 minutes, you can do 15 minutes. You have to try out a little.
1 year ago
Pending
For BTST, intraday, and options trading, both 5-minute and 15-minute time frames can be used, requiring some trial and error to determine personal preference.
So, for BTST intraday and for many people, options trading, but if you do options trading, you have to pay a little attention. You can do 5 minutes, you can do 15 minutes. You have to try out a little.
Pending
While primary analysis for intraday trading should be on the 15-minute timeframe, it is also recommended to glance at the 1-hour timeframe to identify key levels and potential reversal points. This provides an additional layer of context without requiring extensive analysis on that larger frame.
Another suggestion I would make is that you also analyze the one-hour time frame. If you are doing intraday trading, let's say you want to trade at one minute. What did you do? First, go to the 15-minute time frame and observe the market. The market is going up, is in an uptrend. You marked all the important levels. Then, what would you do after that? You could also go to the 1R time frame. Okay, 1R is a larger time frame, but what would happen in this? For example, if you used 1R instead of 15 minutes, you would mark all the important levels. You would know where the highest level is, where the lowest level is, and where the market might reverse. You have to go to One R and take a look once, just look at it. You have to do the major analysis on 15 minutes. And if you are going to trade on 1 minute, then do it on 1 minute. You have to do it on two. One and two. But go to One R and just glance once. This is my glance. This is my glance. This is my glance.
1 year ago
Pending
While primary analysis for intraday trading should be on the 15-minute timeframe, it is also recommended to glance at the 1-hour timeframe to identify key levels and potential reversal points. This provides an additional layer of context without requiring extensive analysis on that larger frame.
Another suggestion I would make is that you also analyze the one-hour time frame. If you are doing intraday trading, let's say you want to trade at one minute. What did you do? First, go to the 15-minute time frame and observe the market. The market is going up, is in an uptrend. You marked all the important levels. Then, what would you do after that? You could also go to the 1R time frame. Okay, 1R is a larger time frame, but what would happen in this? For example, if you used 1R instead of 15 minutes, you would mark all the important levels. You would know where the highest level is, where the lowest level is, and where the market might reverse. You have to go to One R and take a look once, just look at it. You have to do the major analysis on 15 minutes. And if you are going to trade on 1 minute, then do it on 1 minute. You have to do it on two. One and two. But go to One R and just glance once. This is my glance. This is my glance. This is my glance.
Pending
For options trading, analysis should be done on the 15-minute time frame, with trades then taken on 5, 3, 2, or 1-minute time frames. The 1-minute time frame can assist in placing accurate stop losses, entries, and targets.
So, okay, you have to analyze on 15 minutes. After that, you can take trades on 5 minutes, 3 minutes, 2 minutes, 1 minute. And at the same time, smaller time frames will also help you in placing stop losses correctly. So, in this way, 1 minute can give you the best stop loss, best entry and best target.
1 year ago
Pending
For options trading, analysis should be done on the 15-minute time frame, with trades then taken on 5, 3, 2, or 1-minute time frames. The 1-minute time frame can assist in placing accurate stop losses, entries, and targets.
So, okay, you have to analyze on 15 minutes. After that, you can take trades on 5 minutes, 3 minutes, 2 minutes, 1 minute. And at the same time, smaller time frames will also help you in placing stop losses correctly. So, in this way, 1 minute can give you the best stop loss, best entry and best target.
Pending
To be consistently profitable in intraday trading, multi-timeframe analysis is essential. This involves analyzing the market on at least two different time frames, such as 15 minutes and 1 minute, ensuring that the analysis aligns across these frames before taking a trade.
You will trade there only when both your analyses match. You should always use multi-timeframe analysis. Look, if you want to be profitable in intraday trading very seriously and for a very long time, then you have to do multi-timeframe analysis. Like we looked at the 15-minute and 1-minute charts. What did you do? First, analyze the market in 15 minutes. Whether you want to trade in 1 minute or Whether you want to trade at 5 minutes, 3 minutes, or 15 minutes, you have to analyze the market. This means you have to analyze it at 15 minutes as well. And if you want to trade at 1 minute, you have to analyze it at 1 minute as well. This is called multi-time frame analysis. You are analyzing the market on two different time frames.
1 year ago
Pending
To be consistently profitable in intraday trading, multi-timeframe analysis is essential. This involves analyzing the market on at least two different time frames, such as 15 minutes and 1 minute, ensuring that the analysis aligns across these frames before taking a trade.
You will trade there only when both your analyses match. You should always use multi-timeframe analysis. Look, if you want to be profitable in intraday trading very seriously and for a very long time, then you have to do multi-timeframe analysis. Like we looked at the 15-minute and 1-minute charts. What did you do? First, analyze the market in 15 minutes. Whether you want to trade in 1 minute or Whether you want to trade at 5 minutes, 3 minutes, or 15 minutes, you have to analyze the market. This means you have to analyze it at 15 minutes as well. And if you want to trade at 1 minute, you have to analyze it at 1 minute as well. This is called multi-time frame analysis. You are analyzing the market on two different time frames.
Pending
While 1, 2, and 3-minute time frames can help find the best entries and patterns, direct trading on these short time frames without higher time frame analysis (like 15 minutes) should be avoided.
You need to find the best breakout, the best breakdown. You need to look for the best patterns. But one thing you have to keep in mind. You should never trade directly on the one minute, nor should you trade directly on the two minutes, nor should you trade directly on the three minutes. Here, even in 15 minutes, you know that the market is going up. It is going up in 5 minutes, it is going up in 3 minutes. You have done the rest of the analysis as well. Now you come to the nine minutes and find the best entry. After finding the entry, you take the trade. You must have understood that 1 minute, 2 minutes, these will help you find out the best possible entries and will help you take trades on the best possible entries.
1 year ago
Pending
While 1, 2, and 3-minute time frames can help find the best entries and patterns, direct trading on these short time frames without higher time frame analysis (like 15 minutes) should be avoided.
You need to find the best breakout, the best breakdown. You need to look for the best patterns. But one thing you have to keep in mind. You should never trade directly on the one minute, nor should you trade directly on the two minutes, nor should you trade directly on the three minutes. Here, even in 15 minutes, you know that the market is going up. It is going up in 5 minutes, it is going up in 3 minutes. You have done the rest of the analysis as well. Now you come to the nine minutes and find the best entry. After finding the entry, you take the trade. You must have understood that 1 minute, 2 minutes, these will help you find out the best possible entries and will help you take trades on the best possible entries.
Pending
For scalping, a 1-minute time frame is considered useful, and 1-minute and 2-minute time frames are generally useful for this trading style.
Look, a scalper is different, okay, for scalping, a 1-minute time frame will be useful for you because obviously 15 minutes will not be useful there because many people trade for 2 minutes, so if you want to trade for 2 minutes, you want to trade for 3 minutes, you want to trade for 4 minutes, then you don't want to trade for 15 minutes. You'll look at candles. Certainly, 1-minute and 2-minute time frames are useful for scalping.
1 year ago
Pending
For scalping, a 1-minute time frame is considered useful, and 1-minute and 2-minute time frames are generally useful for this trading style.
Look, a scalper is different, okay, for scalping, a 1-minute time frame will be useful for you because obviously 15 minutes will not be useful there because many people trade for 2 minutes, so if you want to trade for 2 minutes, you want to trade for 3 minutes, you want to trade for 4 minutes, then you don't want to trade for 15 minutes. You'll look at candles. Certainly, 1-minute and 2-minute time frames are useful for scalping.
Pending
15-minute time frame is considered optimal for intraday trading analysis because it allows for analysis of trades lasting 2-5 hours without needing to look at an excessive number of candles, unlike 1 or 2-minute time frames. A 1-hour candle can obscure significant intra-hour movements, impacting entry points and profits.
And I think it's one of the best for intraday trading. It is the best because, look, in intraday trading in the market, your trades usually happen between two to three hours, three to four hours, or four to five hours. To analyze them, if you go to a 1-minute time frame or a 2-minute time frame, you will have to look at any number of candles for a 4-hour trade. Similarly, if you talk about 15 minutes, then in 15 minutes, if you want to analyze one hour, you have to look at one hour. This means that one hour will be broken into four pieces because 50 * 4 = 60 minutes. I hope this is not complicated. Stay with me. Okay, if there is a 15-minute candle, then again there will be another 15-minute candle, another 15-minute candle, another 15-minute candle. Now, if we combine these four candles, it becomes one hour. Correct? Many people also use a one-hour time frame, meaning one candle will be one hour. But what happens in this is that within one hour, the market It can also go very high or low, which will prevent you from making good entries and good profits. For this reason, 15 minutes is the best time frame for analysis.
1 year ago
Pending
15-minute time frame is considered optimal for intraday trading analysis because it allows for analysis of trades lasting 2-5 hours without needing to look at an excessive number of candles, unlike 1 or 2-minute time frames. A 1-hour candle can obscure significant intra-hour movements, impacting entry points and profits.
And I think it's one of the best for intraday trading. It is the best because, look, in intraday trading in the market, your trades usually happen between two to three hours, three to four hours, or four to five hours. To analyze them, if you go to a 1-minute time frame or a 2-minute time frame, you will have to look at any number of candles for a 4-hour trade. Similarly, if you talk about 15 minutes, then in 15 minutes, if you want to analyze one hour, you have to look at one hour. This means that one hour will be broken into four pieces because 50 * 4 = 60 minutes. I hope this is not complicated. Stay with me. Okay, if there is a 15-minute candle, then again there will be another 15-minute candle, another 15-minute candle, another 15-minute candle. Now, if we combine these four candles, it becomes one hour. Correct? Many people also use a one-hour time frame, meaning one candle will be one hour. But what happens in this is that within one hour, the market It can also go very high or low, which will prevent you from making good entries and good profits. For this reason, 15 minutes is the best time frame for analysis.
Pending
For intraday trading, 15 minutes is recommended as the best time frame for analysis, avoiding 30 minutes and shorter timeframes like 1, 2, or 3 minutes for primary analysis.
First, cut out the 30 minutes. Intraday trading is very fast. Let me explain. In 15 minutes, the market can move up or down by ₹₹. Whereas, if you talk about 1-minute candlesticks, you can capture small movements, but you shouldn't go as low as 1 minute. What you have to do is first cut out 30 from the time frame. Okay, 30 is cut out. Now, instead of 15, 5, 3, 2, and 3, we will select 1. One here. We will put 2 aside for now. I will explain everything. Stay with me for a while. 15 minutes is my personal favorite. If you're talking about intraday trading, I'll explain why the 15-minute time frame is my favorite. And I think it's one of the best for intraday trading.
1 year ago
Pending
For intraday trading, 15 minutes is recommended as the best time frame for analysis, avoiding 30 minutes and shorter timeframes like 1, 2, or 3 minutes for primary analysis.
First, cut out the 30 minutes. Intraday trading is very fast. Let me explain. In 15 minutes, the market can move up or down by ₹₹. Whereas, if you talk about 1-minute candlesticks, you can capture small movements, but you shouldn't go as low as 1 minute. What you have to do is first cut out 30 from the time frame. Okay, 30 is cut out. Now, instead of 15, 5, 3, 2, and 3, we will select 1. One here. We will put 2 aside for now. I will explain everything. Stay with me for a while. 15 minutes is my personal favorite. If you're talking about intraday trading, I'll explain why the 15-minute time frame is my favorite. And I think it's one of the best for intraday trading.
Pending
Shorter time frames like 5, 3, 2, and 1 minute are primarily designed for intraday and options trading due to their volatility. For intraday trading, 5-minute is preferred for very short durations (1-2 hours), while 15-minute is better for longer intraday durations (3-4+ hours).
So, you have to keep one thing in mind: the shorter you go, the more you go 5 minutes, 3 minutes, 2 minutes, 1 minute. You can go shorter, you saw there is also a one second option, but does the shorter you go with all these things mean that your trades will be better? Okay, first let's talk about 5 minutes and there is a lot of confusion about whether you should use 5 minutes. Now see, as we said, you can use 5 minutes in intraday as well. You can use 5 minutes or 15 minutes in intraday, so which one should you use?
1 year ago
Pending
Shorter time frames like 5, 3, 2, and 1 minute are primarily designed for intraday and options trading due to their volatility. For intraday trading, 5-minute is preferred for very short durations (1-2 hours), while 15-minute is better for longer intraday durations (3-4+ hours).
So, you have to keep one thing in mind: the shorter you go, the more you go 5 minutes, 3 minutes, 2 minutes, 1 minute. You can go shorter, you saw there is also a one second option, but does the shorter you go with all these things mean that your trades will be better? Okay, first let's talk about 5 minutes and there is a lot of confusion about whether you should use 5 minutes. Now see, as we said, you can use 5 minutes in intraday as well. You can use 5 minutes or 15 minutes in intraday, so which one should you use?
Pending
The 15-minute time frame is the most preferred time frame for intraday traders.
So, after one, if we talk about one of the most popular time frames, it is 15 minutes. 15 minutes is the most preferred time frame for intraday traders.
1 year ago
Pending
The 15-minute time frame is the most preferred time frame for intraday traders.
So, after one, if we talk about one of the most popular time frames, it is 15 minutes. 15 minutes is the most preferred time frame for intraday traders.
Pending
The one-hour time frame is useful for intraday trading, swing trading, and BTST trading.
Okay, then comes the one hour time frame. Okay, look, the one hour time frames are completely useless. They are definitely useful, but we just have to explain the pros and cons of comparison. That is why I am mentioning all the points and trying to explain everything. Okay, then comes the one hour time frame. Okay, look, the one hour time frame is used by many people in intraday trading, swing trading, and also in BTST trading for these types of trades.
1 year ago
Pending
The one-hour time frame is useful for intraday trading, swing trading, and BTST trading.
Okay, then comes the one hour time frame. Okay, look, the one hour time frames are completely useless. They are definitely useful, but we just have to explain the pros and cons of comparison. That is why I am mentioning all the points and trying to explain everything. Okay, then comes the one hour time frame. Okay, look, the one hour time frame is used by many people in intraday trading, swing trading, and also in BTST trading for these types of trades.
Pending
For BTST trades and understanding short-term market movements within a month, using weekly time frames alongside monthly ones is beneficial.
It is also not useful for BTST trades. So, multi-time frame analysis asks us, what did you do first? You checked the one-month time frame and broke it into four parts. There are four weeks in a month, right? So, in a month You'll see a candle. Now, you'll know what happened in that one candle four times. In the weekly time frame, it'll be known in four parts.
1 year ago
Pending
For BTST trades and understanding short-term market movements within a month, using weekly time frames alongside monthly ones is beneficial.
It is also not useful for BTST trades. So, multi-time frame analysis asks us, what did you do first? You checked the one-month time frame and broke it into four parts. There are four weeks in a month, right? So, in a month You'll see a candle. Now, you'll know what happened in that one candle four times. In the weekly time frame, it'll be known in four parts.
Pending
The daily time frame offers a higher number of trades for swing trading compared to the weekly time frame, which has fewer trades suitable for positional trading.
And in this you have to keep two things in mind. If we talk about the pros and cons, then here you will see a higher number of trades. You will see more trades. On the weekly time frame, if you go looking for trades which are for positional trades, then you will see very few trades. But on the daily time frame, you can find a lot of trades for swing trading.
1 year ago
Pending
The daily time frame offers a higher number of trades for swing trading compared to the weekly time frame, which has fewer trades suitable for positional trading.
And in this you have to keep two things in mind. If we talk about the pros and cons, then here you will see a higher number of trades. You will see more trades. On the weekly time frame, if you go looking for trades which are for positional trades, then you will see very few trades. But on the daily time frame, you can find a lot of trades for swing trading.
Pending
The 5x margin in intraday trading amplifies both potential profits and losses, acting as a double-edged sword.
You get 5x margin in intraday trading, but it's a double-edged sword. Profit can be five times, loss can also be five times.
1 year ago
Pending
The 5x margin in intraday trading amplifies both potential profits and losses, acting as a double-edged sword.
You get 5x margin in intraday trading, but it's a double-edged sword. Profit can be five times, loss can also be five times.
Pending
The one-day time frame is considered one of the best for swing trading.
If you do swing trading, then it is not that useful for positional trading. That is a side, if you do swing trading, especially for swing trading, the one-day time frame is considered one of the best.
1 year ago
Pending
The one-day time frame is considered one of the best for swing trading.
If you do swing trading, then it is not that useful for positional trading. That is a side, if you do swing trading, especially for swing trading, the one-day time frame is considered one of the best.
Pending
Beginners are strongly advised against options trading and should focus on intraday or swing trading, aiming for at least one year of equity trading experience before considering options.
Look, I've said it two or three times in the video that beginners, whether you do intraday or swing trading, you don't have to do options. I've made it clear. Whether you do intraday or swing trading, you don't have to do options. I've made it clear to you. If you're a beginner, you should have at least one year of equity trading experience. Only then should you consider options trading.
1 year ago
Pending
Beginners are strongly advised against options trading and should focus on intraday or swing trading, aiming for at least one year of equity trading experience before considering options.
Look, I've said it two or three times in the video that beginners, whether you do intraday or swing trading, you don't have to do options. I've made it clear. Whether you do intraday or swing trading, you don't have to do options. I've made it clear to you. If you're a beginner, you should have at least one year of equity trading experience. Only then should you consider options trading.
Pending
For positional trading, a combination of one-week and one-month time frames is recommended for better market understanding.
But for positional trading, I suggest that you use a mix of these two time frames – one week and one month – so that you know what is happening here.
1 year ago
Pending
For positional trading, a combination of one-week and one-month time frames is recommended for better market understanding.
But for positional trading, I suggest that you use a mix of these two time frames – one week and one month – so that you know what is happening here.
Pending
Profit in swing trading is realized only after the trade is closed, which can occur after several days, weeks, or even months.
Talking about swing trading, you can trade for a few days to a few weeks, though it can also be weeks or months. You can also take a trade or hold a trade for two months or three months. Then you will make an actual profit because until you square off the trade, suppose you bought stock XY at ₹1 and today it has been two months, okay, let's say two months have passed and today its price is ₹10. So, you have made a profit of ₹10. But until you sell this share, you bought it and now it is trading at 120. Until you sell it, the actual profit does not come to you. So, in swing trading, you get profit after some time.
1 year ago
Pending
Profit in swing trading is realized only after the trade is closed, which can occur after several days, weeks, or even months.
Talking about swing trading, you can trade for a few days to a few weeks, though it can also be weeks or months. You can also take a trade or hold a trade for two months or three months. Then you will make an actual profit because until you square off the trade, suppose you bought stock XY at ₹1 and today it has been two months, okay, let's say two months have passed and today its price is ₹10. So, you have made a profit of ₹10. But until you sell this share, you bought it and now it is trading at 120. Until you sell it, the actual profit does not come to you. So, in swing trading, you get profit after some time.
Pending
The one-month time frame is considered one of the best for positional trading, allowing analysis of the market's annual performance and sentiment.
So, for positional trading, the one-month time frame is considered one of the best because here you see what happens, how was the market performing throughout the year or was there liance on it, was there bearish reliance on it, was there bearish sentiment here?
1 year ago
Pending
The one-month time frame is considered one of the best for positional trading, allowing analysis of the market's annual performance and sentiment.
So, for positional trading, the one-month time frame is considered one of the best because here you see what happens, how was the market performing throughout the year or was there liance on it, was there bearish reliance on it, was there bearish sentiment here?
Pending
Profits and losses in options trading are typically realized within a short term, often within the same day or a few days.
in options trading also you can close the position within a day, but usually you hold the position for about a few days, so this is also short term, that is, in intraday as well as in options trading, you will get to see profit or loss within the short term, not even short, but very short term
1 year ago
Pending
Profits and losses in options trading are typically realized within a short term, often within the same day or a few days.
in options trading also you can close the position within a day, but usually you hold the position for about a few days, so this is also short term, that is, in intraday as well as in options trading, you will get to see profit or loss within the short term, not even short, but very short term
Pending
Profits and losses in intraday trading are realized within the same day.
this happens in intraday trading that you took the trade today, okay, you exited today and got profit today, okay, this is intraday trading, in options trading also you can close the position within a day, but usually you hold the position for about a few days, so this is also short term, that is, in intraday as well as in options trading, you will get to see profit or loss within the short term, not even short, but very short term
1 year ago
Pending
Profits and losses in intraday trading are realized within the same day.
this happens in intraday trading that you took the trade today, okay, you exited today and got profit today, okay, this is intraday trading, in options trading also you can close the position within a day, but usually you hold the position for about a few days, so this is also short term, that is, in intraday as well as in options trading, you will get to see profit or loss within the short term, not even short, but very short term
Pending
Swing trading generally requires more capital than intraday trading due to the absence of 5x margin. While it can technically be started with ₹10,000, a larger capital is advised for learning.
and in swing trading also a little more capital will be required comparatively because normally if you talk like that, then it will be more in comparison to intraday trading because there is no such thing as margin here, okay, there is no margin here, if there is margin then it is different from the broker's side, but I am telling directly, not 5x margin, okay, so here you will need a little more capital compared to intraday trading, but still swing trading can also be done from 10 You can start with a capital of Rs. 100, but you should n't do it if you want to learn.
1 year ago
Pending
Swing trading generally requires more capital than intraday trading due to the absence of 5x margin. While it can technically be started with ₹10,000, a larger capital is advised for learning.
and in swing trading also a little more capital will be required comparatively because normally if you talk like that, then it will be more in comparison to intraday trading because there is no such thing as margin here, okay, there is no margin here, if there is margin then it is different from the broker's side, but I am telling directly, not 5x margin, okay, so here you will need a little more capital compared to intraday trading, but still swing trading can also be done from 10 You can start with a capital of Rs. 100, but you should n't do it if you want to learn.
Pending
Intraday trading can be started with as little as ₹5,000, and with 5x margin, a capital of ₹10,000 can control shares worth ₹50,000.
Then if we talk about intraday trading, then in intraday trading you can trade even with very little capital. If you want, you can start from ₹5000000. Here you will also get five times margin, okay, 5x margin too, which means if you have ₹1000000, then you can buy or sell shares worth ₹5000000 using 5x margin from ₹1000000.
1 year ago
Pending
Intraday trading can be started with as little as ₹5,000, and with 5x margin, a capital of ₹10,000 can control shares worth ₹50,000.
Then if we talk about intraday trading, then in intraday trading you can trade even with very little capital. If you want, you can start from ₹5000000. Here you will also get five times margin, okay, 5x margin too, which means if you have ₹1000000, then you can buy or sell shares worth ₹5000000 using 5x margin from ₹1000000.
Pending
Option selling requires a minimum capital of ₹1 lakh.
Now, if we talk about option selling, you need a capital of at least ₹1 lakh to sell a contract, below that you cannot even do option selling.
1 year ago
Pending
Option selling requires a minimum capital of ₹1 lakh.
Now, if we talk about option selling, you need a capital of at least ₹1 lakh to sell a contract, below that you cannot even do option selling.
Pending
For profitable options buying, a minimum capital of ₹30,000-50,000 is recommended, although learning can start with ₹1 lakh.
and options trading requires less money, less capital. If you want, you can start with ₹1000000, you can do it, but you should not do it, you should keep a minimum capital of ₹30, 40, 50,000 if you want to do it profitably, but if you want to learn, you can start options buying with ₹1 lakh as well.
1 year ago
Pending
For profitable options buying, a minimum capital of ₹30,000-50,000 is recommended, although learning can start with ₹1 lakh.
and options trading requires less money, less capital. If you want, you can start with ₹1000000, you can do it, but you should not do it, you should keep a minimum capital of ₹30, 40, 50,000 if you want to do it profitably, but if you want to learn, you can start options buying with ₹1 lakh as well.
Pending
Swing trading requires significantly less time commitment compared to intraday trading, involving monitoring trades a few times a day for positions held over days to weeks.
I think swing trading requires comparatively the least time. Okay, if we talk about time, you've taken a trade today and are going to hold it for a few days to a few weeks. You can hold that trade for a few days to a few weeks. So, you'll keep watching it every minute to see if the market is going up or down. You've placed a stop loss, you've set your target, you'll wait for a few days, or you'll simply open the market four or five times a day and watch the news.
1 year ago
Pending
Swing trading requires significantly less time commitment compared to intraday trading, involving monitoring trades a few times a day for positions held over days to weeks.
I think swing trading requires comparatively the least time. Okay, if we talk about time, you've taken a trade today and are going to hold it for a few days to a few weeks. You can hold that trade for a few days to a few weeks. So, you'll keep watching it every minute to see if the market is going up or down. You've placed a stop loss, you've set your target, you'll wait for a few days, or you'll simply open the market four or five times a day and watch the news.
Pending
Intraday trading requires a full-time commitment, similar to a job, from market open to market close.
So intraday trading is almost like a job. I feel that if you want to earn money seriously in intraday trading, okay, if you want to earn money seriously in intraday trading, then as soon as the market opens, not exactly at 915, but as soon as the market opens, after some time you have to remain in the market and until the market closes at 315 or 330. You have to sit in the market, like a job. You have to put in the time here
1 year ago
Pending
Intraday trading requires a full-time commitment, similar to a job, from market open to market close.
So intraday trading is almost like a job. I feel that if you want to earn money seriously in intraday trading, okay, if you want to earn money seriously in intraday trading, then as soon as the market opens, not exactly at 915, but as soon as the market opens, after some time you have to remain in the market and until the market closes at 315 or 330. You have to sit in the market, like a job. You have to put in the time here
Pending
Beginners should have at least one year of experience in intraday or swing trading before considering options trading.
Understand that options trading is a paragraph of the stock market. Paragraphs or like this, if you do not have experience of ABCD, then how will you write like this? You should have at least 1 year of experience, whether it is in intraday trading, swing trading or any other type of trading. You should have at least 1 year of experience, only then you have to think about or do options trading.
1 year ago
Pending
Beginners should have at least one year of experience in intraday or swing trading before considering options trading.
Understand that options trading is a paragraph of the stock market. Paragraphs or like this, if you do not have experience of ABCD, then how will you write like this? You should have at least 1 year of experience, whether it is in intraday trading, swing trading or any other type of trading. You should have at least 1 year of experience, only then you have to think about or do options trading.
Pending
If an uptrend following a downtrend breaches multiple Fibonacci levels, it suggests a reversal and a potential continuation of the downtrend.
Or if the market is going downward, and we took it up. 1 break, 2 break, 3 break, 4 break, then break, so it means the market can reverse and go now.
1 year ago
Pending
If an uptrend following a downtrend breaches multiple Fibonacci levels, it suggests a reversal and a potential continuation of the downtrend.
Or if the market is going downward, and we took it up. 1 break, 2 break, 3 break, 4 break, then break, so it means the market can reverse and go now.
Pending
A break of the 0.6 Fibonacci level signifies the conclusion of a retracement and indicates a probable trend reversal, leading to a downward market continuation.
As soon as it breaks 0.6. It has broken 0.6. This means that there is a chance of a reversal. Retracement is over. Instead of going upward, the market will continue down.
1 year ago
Pending
A break of the 0.6 Fibonacci level signifies the conclusion of a retracement and indicates a probable trend reversal, leading to a downward market continuation.
As soon as it breaks 0.6. It has broken 0.6. This means that there is a chance of a reversal. Retracement is over. Instead of going upward, the market will continue down.
Pending
The 0.382 Fibonacci level acted as a turning point, from which the market resumed its upward movement after a retracement.
So, the market took a retracement up to here. Then, after that, look, our point was 0.382. From there, the market again started moving in the continuous upward direction.
1 year ago
Pending
The 0.382 Fibonacci level acted as a turning point, from which the market resumed its upward movement after a retracement.
So, the market took a retracement up to here. Then, after that, look, our point was 0.382. From there, the market again started moving in the continuous upward direction.
Pending
The five key Fibonacci levels (0.236, 0.382, 0.5, 0.618, and 0.786) indicate future points where the market is expected to continue its current trend.
So, these 5 points tell us where the market can continue again the direction of the trend.
1 year ago
Pending
The five key Fibonacci levels (0.236, 0.382, 0.5, 0.618, and 0.786) indicate future points where the market is expected to continue its current trend.
So, these 5 points tell us where the market can continue again the direction of the trend.
Pending
The Fibonacci levels of 0.382, 0.5, and 0.618 are significant points from which a downward trend is likely to continue after a retracement.
So here, 1, 2, 0.38, 0.5, 0.61, these are the three major points from where it goes down. And as soon as it retraces from this level, it starts to retracement ends, the market continues in the same direction.
1 year ago
Pending
The Fibonacci levels of 0.382, 0.5, and 0.618 are significant points from which a downward trend is likely to continue after a retracement.
So here, 1, 2, 0.38, 0.5, 0.61, these are the three major points from where it goes down. And as soon as it retraces from this level, it starts to retracement ends, the market continues in the same direction.
Pending
The Fibonacci retracement levels of 0.236, 0.382, 0.5, 0.618, and 0.786 are critical points where the market is anticipated to continue its prevailing trend.
These are the three points which you have to look for the most. Now I will explain this to you in detail. It might be a little difficult now, but bear with me, bear with me. So I told you some numbers, 0.382, 0.23, 0.5, 0.618, 0.786. These are the points from where the market will continue in the direction of the trend.
1 year ago
Pending
The Fibonacci retracement levels of 0.236, 0.382, 0.5, 0.618, and 0.786 are critical points where the market is anticipated to continue its prevailing trend.
These are the three points which you have to look for the most. Now I will explain this to you in detail. It might be a little difficult now, but bear with me, bear with me. So I told you some numbers, 0.382, 0.23, 0.5, 0.618, 0.786. These are the points from where the market will continue in the direction of the trend.
Pending
Fibonacci levels provide insights into the extent of market retracements and the specific price points from which a trend is likely to resume.
So, it will come down a little bit. Now we know how much it will come down. But how much level will it come down? And from where will it go up again? This is what the Fibonacci levels tell us.
1 year ago
Pending
Fibonacci levels provide insights into the extent of market retracements and the specific price points from which a trend is likely to resume.
So, it will come down a little bit. Now we know how much it will come down. But how much level will it come down? And from where will it go up again? This is what the Fibonacci levels tell us.
Pending
In fast-moving markets with strong trends and small retracements, the Fibonacci levels of 0.236 and 0.382 are significant for identifying potential trend continuations or reversals.
And when the market is moving like this, as you can see here, let me show you. It's moving like this, you can see. So, the movements in this, you can see, the retracements are also big. Okay? The retracements are big, basically, the market is moving, moving, up and down. Even though it's an uptrend in the long term, but the market is going up and down. But, a market where it's going up, where there are small breaks and falls in between, in those cases, when the market is moving very fast, 0.2 0.3 These are two important levels.
1 year ago
Pending
In fast-moving markets with strong trends and small retracements, the Fibonacci levels of 0.236 and 0.382 are significant for identifying potential trend continuations or reversals.
And when the market is moving like this, as you can see here, let me show you. It's moving like this, you can see. So, the movements in this, you can see, the retracements are also big. Okay? The retracements are big, basically, the market is moving, moving, up and down. Even though it's an uptrend in the long term, but the market is going up and down. But, a market where it's going up, where there are small breaks and falls in between, in those cases, when the market is moving very fast, 0.2 0.3 These are two important levels.
Pending
If the market breaks through multiple Fibonacci levels during an uptrend that followed a downtrend, it suggests a reversal and a potential continuation of the downtrend.
Or if the market is going downward, and we took it up. 1 break, 2 break, 3 break, 4 break, then break, so it means the market can reverse and go now.
1 year ago
Pending
If the market breaks through multiple Fibonacci levels during an uptrend that followed a downtrend, it suggests a reversal and a potential continuation of the downtrend.
Or if the market is going downward, and we took it up. 1 break, 2 break, 3 break, 4 break, then break, so it means the market can reverse and go now.
Pending
Multi-timeframe analysis is crucial; for 15-minute trades, check the hourly timeframe, and for 5-minute trades, check the 15-minute timeframe.
If you trade 15-minute timeframes, you should also check each hour's timeframe. Similarly, if you trade 5-minute timeframes, you'll also need to check the 15-minute timeframe.
1 year ago
Pending
Multi-timeframe analysis is crucial; for 15-minute trades, check the hourly timeframe, and for 5-minute trades, check the 15-minute timeframe.
If you trade 15-minute timeframes, you should also check each hour's timeframe. Similarly, if you trade 5-minute timeframes, you'll also need to check the 15-minute timeframe.
Pending
Smaller time frames tend to generate a higher number of fake signals.
The smaller the timeframe, the more fake signals you get.
1 year ago
Pending
Smaller time frames tend to generate a higher number of fake signals.
The smaller the timeframe, the more fake signals you get.
Pending
Breaking the 0.6 Fibonacci level signifies the end of a retracement and a strong likelihood of a trend reversal, causing the market to move downwards.
As soon as it breaks 0.6. It has broken 0.6. This means that there is a chance of a reversal. Retracement is over. Instead of going upward, the market will continue down.
1 year ago
Pending
Breaking the 0.6 Fibonacci level signifies the end of a retracement and a strong likelihood of a trend reversal, causing the market to move downwards.
As soon as it breaks 0.6. It has broken 0.6. This means that there is a chance of a reversal. Retracement is over. Instead of going upward, the market will continue down.
Pending
If multiple Fibonacci levels are breached in an uptrend following a downtrend, it strongly suggests a reversal of the trend, with the market likely to continue downwards.
Or if the market is going downward, and we took it up. 1 break, 2 break, 3 break, 4 break, then break, so it means the market can reverse and go now.
1 year ago
Pending
If multiple Fibonacci levels are breached in an uptrend following a downtrend, it strongly suggests a reversal of the trend, with the market likely to continue downwards.
Or if the market is going downward, and we took it up. 1 break, 2 break, 3 break, 4 break, then break, so it means the market can reverse and go now.
Pending
For options trading, the 5-minute time frame is used, but analysis should first be conducted on the 15-minute time frame, regardless of whether one trades on 5 or 3 minutes.
After that, if you are doing options trading, the time frame is 5 minutes. Whether you use a 15-minute time frame or a 3-minute time frame, in both, you have to analyze on the 15-minute time frame.
1 year ago
Pending
For options trading, the 5-minute time frame is used, but analysis should first be conducted on the 15-minute time frame, regardless of whether one trades on 5 or 3 minutes.
After that, if you are doing options trading, the time frame is 5 minutes. Whether you use a 15-minute time frame or a 3-minute time frame, in both, you have to analyze on the 15-minute time frame.
Pending
The 1 and 2-minute time frames are useful for pinpointing the best possible entries for trades.
After finding the entry, you take the trade. You must have understood that 1 minute, 2 minutes, these will help you find out the best possible entries and will help you take trades on the best possible entries.
1 year ago
Pending
The 1 and 2-minute time frames are useful for pinpointing the best possible entries for trades.
After finding the entry, you take the trade. You must have understood that 1 minute, 2 minutes, these will help you find out the best possible entries and will help you take trades on the best possible entries.
Pending
A break of the 0.6 Fibonacci level signals the end of a retracement and the likely start of a trend reversal, leading to a continuation in the opposite direction.
As soon as it breaks 0.6. It has broken 0.6. This means that there is a chance of a reversal. Retracement is over. Instead of going upward, the market will continue down.
1 year ago
Pending
A break of the 0.6 Fibonacci level signals the end of a retracement and the likely start of a trend reversal, leading to a continuation in the opposite direction.
As soon as it breaks 0.6. It has broken 0.6. This means that there is a chance of a reversal. Retracement is over. Instead of going upward, the market will continue down.
Pending
While 1, 2, and 3-minute time frames can help identify optimal entries and patterns, direct trading on these time frames without higher time frame confirmation is discouraged.
You need to find the best breakout, the best breakdown. You need to look for the best patterns. But one thing you have to keep in mind. You should never trade directly on the one minute, nor should you trade directly on the two minutes, nor should you trade directly on the three minutes.
1 year ago
Pending
While 1, 2, and 3-minute time frames can help identify optimal entries and patterns, direct trading on these time frames without higher time frame confirmation is discouraged.
You need to find the best breakout, the best breakdown. You need to look for the best patterns. But one thing you have to keep in mind. You should never trade directly on the one minute, nor should you trade directly on the two minutes, nor should you trade directly on the three minutes.
Pending
The 0.382 Fibonacci level acted as a pivot point, from which the market resumed its upward trajectory after a retracement.
So, the market took a retracement up to here. Then, after that, look, our point was 0.382. From there, the market again started moving in the continuous upward direction.
1 year ago
Pending
The 0.382 Fibonacci level acted as a pivot point, from which the market resumed its upward trajectory after a retracement.
So, the market took a retracement up to here. Then, after that, look, our point was 0.382. From there, the market again started moving in the continuous upward direction.
Pending
The five primary Fibonacci levels (0.236, 0.382, 0.5, 0.618, and 0.786) are indicators of where the market is likely to resume its prevailing trend.
So, these 5 points tell us where the market can continue again the direction of the trend.
1 year ago
Pending
The five primary Fibonacci levels (0.236, 0.382, 0.5, 0.618, and 0.786) are indicators of where the market is likely to resume its prevailing trend.
So, these 5 points tell us where the market can continue again the direction of the trend.
Pending
For scalping, 1-minute and 2-minute time frames are most useful, as 15-minute time frames are not practical for very short trades.
Look, a scalper is different, okay, for scalping, a 1-minute time frame will be useful for you because obviously 15 minutes will not be useful there because many people trade for 2 minutes, so if you want to trade for 2 minutes, you want to trade for 3 minutes, you want to trade for 4 minutes, then you don't want to trade for 15 minutes. You'll look at candles. Certainly, 1-minute and 2-minute time frames are useful for scalping.
1 year ago
Pending
For scalping, 1-minute and 2-minute time frames are most useful, as 15-minute time frames are not practical for very short trades.
Look, a scalper is different, okay, for scalping, a 1-minute time frame will be useful for you because obviously 15 minutes will not be useful there because many people trade for 2 minutes, so if you want to trade for 2 minutes, you want to trade for 3 minutes, you want to trade for 4 minutes, then you don't want to trade for 15 minutes. You'll look at candles. Certainly, 1-minute and 2-minute time frames are useful for scalping.
Pending
For longer intraday trading sessions (3-4 hours or more), the 15-minute time frame is more suitable.
If you do it for a little longer time, like for three to four hours or more than 4 hours, then you should give more preference to 15 minutes.
1 year ago
Pending
For longer intraday trading sessions (3-4 hours or more), the 15-minute time frame is more suitable.
If you do it for a little longer time, like for three to four hours or more than 4 hours, then you should give more preference to 15 minutes.
Pending
The Fibonacci levels of 0.382, 0.5, and 0.618 are key points from which the market is likely to continue its downward trend after a retracement.
So here, 1, 2, 0.38, 0.5, 0.61, these are the three major points from where it goes down. And as soon as it retraces from this level, it starts to retracement ends, the market continues in the same direction.
1 year ago
Pending
The Fibonacci levels of 0.382, 0.5, and 0.618 are key points from which the market is likely to continue its downward trend after a retracement.
So here, 1, 2, 0.38, 0.5, 0.61, these are the three major points from where it goes down. And as soon as it retraces from this level, it starts to retracement ends, the market continues in the same direction.
Pending
For very short-term intraday trading (1-2 hours or less), the 5-minute time frame can be preferred.
Now if you are doing intraday for a very short term, like for one to two hours or even less than that or a little around that, then you can give a little preference to 5 minutes.
1 year ago
Pending
For very short-term intraday trading (1-2 hours or less), the 5-minute time frame can be preferred.
Now if you are doing intraday for a very short term, like for one to two hours or even less than that or a little around that, then you can give a little preference to 5 minutes.
Pending
Shorter time frames (5, 3, 2, 1 minute) are generally used for options trading due to its volatility, but shorter does not necessarily mean better trades.
So, you have to keep one thing in mind: the shorter you go, the more you go 5 minutes, 3 minutes, 2 minutes, 1 minute. You can go shorter, you saw there is also a one second option, but does the shorter you go with all these things mean that your trades will be better?
1 year ago
Pending
Shorter time frames (5, 3, 2, 1 minute) are generally used for options trading due to its volatility, but shorter does not necessarily mean better trades.
So, you have to keep one thing in mind: the shorter you go, the more you go 5 minutes, 3 minutes, 2 minutes, 1 minute. You can go shorter, you saw there is also a one second option, but does the shorter you go with all these things mean that your trades will be better?
Pending
The Fibonacci retracement levels of 0.236, 0.382, 0.5, 0.618, and 0.786 are significant levels where the market is expected to continue its existing trend.
These are the three points which you have to look for the most. Now I will explain this to you in detail. It might be a little difficult now, but bear with me, bear with me. So I told you some numbers, 0.382, 0.23, 0.5, 0.618, 0.786. These are the points from where the market will continue in the direction of the trend.
1 year ago
Pending
The Fibonacci retracement levels of 0.236, 0.382, 0.5, 0.618, and 0.786 are significant levels where the market is expected to continue its existing trend.
These are the three points which you have to look for the most. Now I will explain this to you in detail. It might be a little difficult now, but bear with me, bear with me. So I told you some numbers, 0.382, 0.23, 0.5, 0.618, 0.786. These are the points from where the market will continue in the direction of the trend.
Pending
The 15-minute time frame is considered the best for intraday trading.
Okay, for intraday trading. I think a 15-minute time frame is the best.
1 year ago
Pending
The 15-minute time frame is considered the best for intraday trading.
Okay, for intraday trading. I think a 15-minute time frame is the best.
Pending
Fibonacci levels are predictive tools that indicate the extent of market retracements and the specific price points from which a trend is expected to resume.
So, it will come down a little bit. Now we know how much it will come down. But how much level will it come down? And from where will it go up again? This is what the Fibonacci levels tell us.
1 year ago
Pending
Fibonacci levels are predictive tools that indicate the extent of market retracements and the specific price points from which a trend is expected to resume.
So, it will come down a little bit. Now we know how much it will come down. But how much level will it come down? And from where will it go up again? This is what the Fibonacci levels tell us.
Pending
The one-hour time frame is recommended for BTST trades and for trades held for two to four days.
So, you have to tick one more time frame for BTST trading and you have to tick for the trades that you take for two to three days or three to four days, okay, understood, you have to tick for BTST trades that is buy today sell tomorrow trades and at the same time if you hold any trades for two-three days, buy and sell, then tick for that
1 year ago
Pending
The one-hour time frame is recommended for BTST trades and for trades held for two to four days.
So, you have to tick one more time frame for BTST trading and you have to tick for the trades that you take for two to three days or three to four days, okay, understood, you have to tick for BTST trades that is buy today sell tomorrow trades and at the same time if you hold any trades for two-three days, buy and sell, then tick for that
Pending
In fast-moving markets with significant upward or downward trends and smaller retracements, the 0.236 and 0.382 Fibonacci levels are crucial for identifying potential trend continuations or reversals.
And when the market is moving like this, as you can see here, let me show you. It's moving like this, you can see. So, the movements in this, you can see, the retracements are also big. Okay? The retracements are big, basically, the market is moving, moving, up and down. Even though it's an uptrend in the long term, but the market is going up and down. But, a market where it's going up, where there are small breaks and falls in between, in those cases, when the market is moving very fast, 0.2 0.3 These are two important levels.
1 year ago
Pending
In fast-moving markets with significant upward or downward trends and smaller retracements, the 0.236 and 0.382 Fibonacci levels are crucial for identifying potential trend continuations or reversals.
And when the market is moving like this, as you can see here, let me show you. It's moving like this, you can see. So, the movements in this, you can see, the retracements are also big. Okay? The retracements are big, basically, the market is moving, moving, up and down. Even though it's an uptrend in the long term, but the market is going up and down. But, a market where it's going up, where there are small breaks and falls in between, in those cases, when the market is moving very fast, 0.2 0.3 These are two important levels.
Pending
The one-hour time frame is useful for BTST trades (buy today sell tomorrow) and for trades held for two to three days, but less so for intraday trading which focuses on smaller daily movements.
The one-hour time frame is useful for that. Look, even for intraday trading, one-hour time frame is not that useful because intraday, you try to capture small movements within a day.
1 year ago
Pending
The one-hour time frame is useful for BTST trades (buy today sell tomorrow) and for trades held for two to three days, but less so for intraday trading which focuses on smaller daily movements.
The one-hour time frame is useful for that. Look, even for intraday trading, one-hour time frame is not that useful because intraday, you try to capture small movements within a day.
Pending
If multiple Fibonacci levels are broken consecutively in an uptrend after a downtrend, it signals a high probability of the market reversing and continuing downwards.
Or if the market is going downward, and we took it up. 1 break, 2 break, 3 break, 4 break, then break, so it means the market can reverse and go now.
1 year ago
Pending
If multiple Fibonacci levels are broken consecutively in an uptrend after a downtrend, it signals a high probability of the market reversing and continuing downwards.
Or if the market is going downward, and we took it up. 1 break, 2 break, 3 break, 4 break, then break, so it means the market can reverse and go now.
Pending
The daily time frame allows for the identification of a significant number of trading opportunities for swing trading.
But on the daily time frame, you can find a lot of trades for swing trading.
1 year ago
Pending
The daily time frame allows for the identification of a significant number of trading opportunities for swing trading.
But on the daily time frame, you can find a lot of trades for swing trading.
Pending
Breaking the 0.6 Fibonacci level indicates that the retracement is complete and a reversal of the trend is likely to occur, leading to a continuation in the opposite direction.
As soon as it breaks 0.6. It has broken 0.6. This means that there is a chance of a reversal. Retracement is over. Instead of going upward, the market will continue down.
1 year ago
Pending
Breaking the 0.6 Fibonacci level indicates that the retracement is complete and a reversal of the trend is likely to occur, leading to a continuation in the opposite direction.
As soon as it breaks 0.6. It has broken 0.6. This means that there is a chance of a reversal. Retracement is over. Instead of going upward, the market will continue down.
Pending
For trading short-term movements of one to two months, the daily time frame is more effective than the monthly time frame because the latter condenses too much information into few candles for adequate analysis.
Now, when you want to trade a short-term movement of one or two months, then you have to see that the market is moving for one to two months. How much will it go within? If you look at the monthly time frame, two months will be over in just two candles. Correct, what will you be able to analyze in just two candles? That is why it is important that you focus a little on swing trading on the daily time frame.
1 year ago
Pending
For trading short-term movements of one to two months, the daily time frame is more effective than the monthly time frame because the latter condenses too much information into few candles for adequate analysis.
Now, when you want to trade a short-term movement of one or two months, then you have to see that the market is moving for one to two months. How much will it go within? If you look at the monthly time frame, two months will be over in just two candles. Correct, what will you be able to analyze in just two candles? That is why it is important that you focus a little on swing trading on the daily time frame.
Pending
The one-day time frame is primarily used for swing trading.
So, the time frame that is majorly used for this is the one-day time frame.
1 year ago
Pending
The one-day time frame is primarily used for swing trading.
So, the time frame that is majorly used for this is the one-day time frame.
Pending
The 0.382 Fibonacci level served as a reversal point from which the market resumed its upward trend after a retracement.
So, the market took a retracement up to here. Then, after that, look, our point was 0.382. From there, the market again started moving in the continuous upward direction.
1 year ago
Pending
The 0.382 Fibonacci level served as a reversal point from which the market resumed its upward trend after a retracement.
So, the market took a retracement up to here. Then, after that, look, our point was 0.382. From there, the market again started moving in the continuous upward direction.
Pending
The one-day time frame is considered the best for swing trading.
If you do swing trading, then it is not that useful for positional trading. That is a side, if you do swing trading, especially for swing trading, the one-day time frame is considered one of the best.
1 year ago
Pending
The one-day time frame is considered the best for swing trading.
If you do swing trading, then it is not that useful for positional trading. That is a side, if you do swing trading, especially for swing trading, the one-day time frame is considered one of the best.
Pending
The five key Fibonacci levels (0.236, 0.382, 0.5, 0.618, and 0.786) indicate points where the market is expected to continue its prevailing trend.
So, these 5 points tell us where the market can continue again the direction of the trend.
1 year ago
Pending
The five key Fibonacci levels (0.236, 0.382, 0.5, 0.618, and 0.786) indicate points where the market is expected to continue its prevailing trend.
So, these 5 points tell us where the market can continue again the direction of the trend.
Pending
The weekly time frame is best suited for positional trading, and combining it with the one-month time frame aids in accurate entry and analysis.
So, if we talk about weekly trading or weekly time frame, then it works best for positional trading. By combining one month and one week together, you can find out entries and analysis correctly for positional trading.
1 year ago
Pending
The weekly time frame is best suited for positional trading, and combining it with the one-month time frame aids in accurate entry and analysis.
So, if we talk about weekly trading or weekly time frame, then it works best for positional trading. By combining one month and one week together, you can find out entries and analysis correctly for positional trading.
Pending
For positional trading held for less than 6 months or 1 year, using both one-month and weekly time frames is advised to monitor short-term market movements within weeks.
So, if you do positional trading which is less than 6 months or less than 1 year, then I would suggest that along with the one-month, you should also use the weekly time frame to look at how the market is moving within weeks and how it is performing in the short term.
1 year ago
Pending
For positional trading held for less than 6 months or 1 year, using both one-month and weekly time frames is advised to monitor short-term market movements within weeks.
So, if you do positional trading which is less than 6 months or less than 1 year, then I would suggest that along with the one-month, you should also use the weekly time frame to look at how the market is moving within weeks and how it is performing in the short term.
Pending
The Fibonacci levels of 0.382, 0.5, and 0.618 are significant points from which the market will likely continue its downward trend after a retracement.
So here, 1, 2, 0.38, 0.5, 0.61, these are the three major points from where it goes down. And as soon as it retraces from this level, it starts to retracement ends, the market continues in the same direction.
1 year ago
Pending
The Fibonacci levels of 0.382, 0.5, and 0.618 are significant points from which the market will likely continue its downward trend after a retracement.
So here, 1, 2, 0.38, 0.5, 0.61, these are the three major points from where it goes down. And as soon as it retraces from this level, it starts to retracement ends, the market continues in the same direction.
Pending
For positional trading, a combination of one-week and one-month time frames is recommended for better market understanding.
But for positional trading, I suggest that you use a mix of these two time frames – one week and one month – so that you know what is happening here.
1 year ago
Pending
For positional trading, a combination of one-week and one-month time frames is recommended for better market understanding.
But for positional trading, I suggest that you use a mix of these two time frames – one week and one month – so that you know what is happening here.
Pending
The Fibonacci levels of 0.236, 0.382, 0.5, 0.618, and 0.786 are key areas where the market is likely to continue its existing trend.
These are the three points which you have to look for the most. Now I will explain this to you in detail. It might be a little difficult now, but bear with me, bear with me. So I told you some numbers, 0.382, 0.23, 0.5, 0.618, 0.786. These are the points from where the market will continue in the direction of the trend.
1 year ago
Pending
The Fibonacci levels of 0.236, 0.382, 0.5, 0.618, and 0.786 are key areas where the market is likely to continue its existing trend.
These are the three points which you have to look for the most. Now I will explain this to you in detail. It might be a little difficult now, but bear with me, bear with me. So I told you some numbers, 0.382, 0.23, 0.5, 0.618, 0.786. These are the points from where the market will continue in the direction of the trend.
Pending
Fibonacci levels are used to predict the extent of market retracements and the specific points from which the trend is likely to resume.
So, it will come down a little bit. Now we know how much it will come down. But how much level will it come down? And from where will it go up again? This is what the Fibonacci levels tell us.
1 year ago
Pending
Fibonacci levels are used to predict the extent of market retracements and the specific points from which the trend is likely to resume.
So, it will come down a little bit. Now we know how much it will come down. But how much level will it come down? And from where will it go up again? This is what the Fibonacci levels tell us.
Pending
The one-month time frame is considered one of the best for positional trading to analyze yearly market performance and sentiment.
So, for positional trading, the one-month time frame is considered one of the best because here you see what happens, how was the market performing throughout the year or was there liance on it, was there bearish reliance on it, was there bearish sentiment here?
1 year ago
Pending
The one-month time frame is considered one of the best for positional trading to analyze yearly market performance and sentiment.
So, for positional trading, the one-month time frame is considered one of the best because here you see what happens, how was the market performing throughout the year or was there liance on it, was there bearish reliance on it, was there bearish sentiment here?
Pending
Breaking the 0.6 Fibonacci level signals a high probability of a trend reversal, meaning the retracement is complete and the market will move in the opposite direction.
So, as soon as it breaks 0.6. It has broken 0.6. This means that there is a chance of a reversal. Retracement is over. Instead of going upward, the market will continue down.
1 year ago
Pending
Breaking the 0.6 Fibonacci level signals a high probability of a trend reversal, meaning the retracement is complete and the market will move in the opposite direction.
So, as soon as it breaks 0.6. It has broken 0.6. This means that there is a chance of a reversal. Retracement is over. Instead of going upward, the market will continue down.
Pending
The second Fibonacci level (implied to be 0.382 or similar, as indicated by 'second point') combined with a morning star candlestick pattern signals a potential buying opportunity.
Here, he came to the second point and took a movement in the upward direction. Plus, we got to see the morning star. This is a potential buying point. As soon as you saw the morning star, you can buy here.
1 year ago
Pending
The second Fibonacci level (implied to be 0.382 or similar, as indicated by 'second point') combined with a morning star candlestick pattern signals a potential buying opportunity.
Here, he came to the second point and took a movement in the upward direction. Plus, we got to see the morning star. This is a potential buying point. As soon as you saw the morning star, you can buy here.
Pending
The 0.382 Fibonacci level acted as a point from which the market continued its upward trend.
From there, the market again started moving in the continuous upward direction.
1 year ago
Pending
The 0.382 Fibonacci level acted as a point from which the market continued its upward trend.
From there, the market again started moving in the continuous upward direction.
Pending
The 0.618 Fibonacci level can act as a point of continuation for the prevailing trend.
So here you can see our 0.618 point that came out to be a continuation trend.
1 year ago
Pending
The 0.618 Fibonacci level can act as a point of continuation for the prevailing trend.
So here you can see our 0.618 point that came out to be a continuation trend.
Pending
In markets with very fast upward or downward trends, the Fibonacci levels of 0.236, 0.382, and 0.5 are particularly useful for identifying potential turning points.
So when the market is going up, then it is going very fast, or if it is going down, then it is going down very fast, there you will use 0.236, which is our first level. And 0.382 and 0.5 These three levels will be useful to you.
1 year ago
Pending
In markets with very fast upward or downward trends, the Fibonacci levels of 0.236, 0.382, and 0.5 are particularly useful for identifying potential turning points.
So when the market is going up, then it is going very fast, or if it is going down, then it is going down very fast, there you will use 0.236, which is our first level. And 0.382 and 0.5 These three levels will be useful to you.
Pending
In strong trending markets with significant price movements, reversals are likely to occur around the 0.618 and 0.786 Fibonacci retracement levels.
And when there are big movements When you are getting to see big movements in the market You 0.382 When there is an uptrend in this direction in the market or a downtrend in this direction, then the reversals that you will see will be seen from 0.618 and 0.786.
1 year ago
Pending
In strong trending markets with significant price movements, reversals are likely to occur around the 0.618 and 0.786 Fibonacci retracement levels.
And when there are big movements When you are getting to see big movements in the market You 0.382 When there is an uptrend in this direction in the market or a downtrend in this direction, then the reversals that you will see will be seen from 0.618 and 0.786.
Pending
In strong uptrends with significant upward momentum and smaller retracements, the 0.236 and 0.382 Fibonacci levels are important indicators for potential reversals or continuation points.
And when the market is moving like this, as you can see here, let me show you. It's moving like this, you can see. So, the movements in this, you can see, the retracements are also big. Okay? The retracements are big, basically, the market is moving, moving, up and down. Even though it's an uptrend in the long term, but the market is going up and down. But, a market where it's going up, where there are small breaks and falls in between, in those cases, when the market is moving very fast, 0.2 0.3 These are two important levels.
1 year ago
Pending
In strong uptrends with significant upward momentum and smaller retracements, the 0.236 and 0.382 Fibonacci levels are important indicators for potential reversals or continuation points.
And when the market is moving like this, as you can see here, let me show you. It's moving like this, you can see. So, the movements in this, you can see, the retracements are also big. Okay? The retracements are big, basically, the market is moving, moving, up and down. Even though it's an uptrend in the long term, but the market is going up and down. But, a market where it's going up, where there are small breaks and falls in between, in those cases, when the market is moving very fast, 0.2 0.3 These are two important levels.
Pending
If the market breaks key Fibonacci levels (specifically referring to breaking past multiple levels like 1, 2, 3, 4 after an uptrend, or implied breaking of downtrend levels), it signifies a potential reversal of the trend.
Or if the market is going downward, and we took it up. 1 break, 2 break, 3 break, 4 break, then break, so it means the market can reverse and go now.
1 year ago
Pending
If the market breaks key Fibonacci levels (specifically referring to breaking past multiple levels like 1, 2, 3, 4 after an uptrend, or implied breaking of downtrend levels), it signifies a potential reversal of the trend.
Or if the market is going downward, and we took it up. 1 break, 2 break, 3 break, 4 break, then break, so it means the market can reverse and go now.
Pending
If the market breaks the 0.6 Fibonacci level, it indicates a reversal and continuation in the opposite direction of the trend. This applies to both uptrends and downtrends.
As soon as it breaks four numbers. We talked about five numbers. That is 0.2, 0.3, 0.5, 0.6 and 0.7. So as soon as it breaks 0.6. It has broken 0.6. This means that there is a chance of a reversal. Retracement is over. Instead of going upward, the market will continue down.
1 year ago
Pending
If the market breaks the 0.6 Fibonacci level, it indicates a reversal and continuation in the opposite direction of the trend. This applies to both uptrends and downtrends.
As soon as it breaks four numbers. We talked about five numbers. That is 0.2, 0.3, 0.5, 0.6 and 0.7. So as soon as it breaks 0.6. It has broken 0.6. This means that there is a chance of a reversal. Retracement is over. Instead of going upward, the market will continue down.
Pending
In markets with large up and down movements, even within a long-term uptrend, if there are small breaks and falls, Fibonacci levels 0.2 and 0.3 become important for analyzing the trend's continuation.
And when the market is moving like this, as you can see here, let me show you. It's moving like this, you can see. So, the movements in this, you can see, the retracements are also big. Okay? The retracements are big, basically, the market is moving, moving, up and down. Even though it's an uptrend in the long term, but the market is going up and down. But, a market where it's going up, where there are small breaks and falls in between, in those cases, when the market is moving very fast, 0.2 0.3 These are two important levels.
1 year ago
Pending
In markets with large up and down movements, even within a long-term uptrend, if there are small breaks and falls, Fibonacci levels 0.2 and 0.3 become important for analyzing the trend's continuation.
And when the market is moving like this, as you can see here, let me show you. It's moving like this, you can see. So, the movements in this, you can see, the retracements are also big. Okay? The retracements are big, basically, the market is moving, moving, up and down. Even though it's an uptrend in the long term, but the market is going up and down. But, a market where it's going up, where there are small breaks and falls in between, in those cases, when the market is moving very fast, 0.2 0.3 These are two important levels.
Pending
Combining support levels with Fibonacci levels provides strong confirmation for trading decisions, indicating two reliable points of reference.
First thing, you can identify a support level here. ... So in the market, you got a support level, plus you got this Fibonacci level. These are two of our points, which means that here we got two confirmations.
1 year ago
Pending
Combining support levels with Fibonacci levels provides strong confirmation for trading decisions, indicating two reliable points of reference.
First thing, you can identify a support level here. ... So in the market, you got a support level, plus you got this Fibonacci level. These are two of our points, which means that here we got two confirmations.
Pending
A potential buying opportunity arises when the market reaches the second Fibonacci level and forms a Morning Star candlestick pattern, indicating a likely upward movement.
So here, he came to the second point and took a movement in the upward direction. Plus, we got to see the morning star. This is a potential buying point. As soon as you saw the morning star, you can buy here.
1 year ago
Pending
A potential buying opportunity arises when the market reaches the second Fibonacci level and forms a Morning Star candlestick pattern, indicating a likely upward movement.
So here, he came to the second point and took a movement in the upward direction. Plus, we got to see the morning star. This is a potential buying point. As soon as you saw the morning star, you can buy here.
Pending
Approximately 90% of the time, market reversals will occur at Fibonacci levels 0.236, 0.382, or 0.5.
Always most of the time, 90 percent of the time. It will, what it will do is it will only reverse from these points, 0.236, 0.382 or 0.5.
1 year ago
Pending
Approximately 90% of the time, market reversals will occur at Fibonacci levels 0.236, 0.382, or 0.5.
Always most of the time, 90 percent of the time. It will, what it will do is it will only reverse from these points, 0.236, 0.382 or 0.5.
Pending
Once a Fibonacci retracement ends, traders should take a trade in the direction of the existing trend, as indicated by the Fibonacci tools.
So, as soon as it ends, you have to take a trade in the same direction of the trend. These are the Fibonacci tools that tell you.
1 year ago
Pending
Once a Fibonacci retracement ends, traders should take a trade in the direction of the existing trend, as indicated by the Fibonacci tools.
So, as soon as it ends, you have to take a trade in the same direction of the trend. These are the Fibonacci tools that tell you.
Pending
Fibonacci levels can be used to identify potential entry points for trades. After a retracement, when momentum candles or chart patterns confirm the direction, a trade can be taken in alignment with the trend.
So Fibonacci point and also explains how to take trades. Let's say market up, Fibonacci will tell you that when it came down, it will go up from here. As soon as you know the Fibonacci level, in a particular movement, you get momentum candles, you get a particular chart pattern, from there you can take a trade in the up direction, in the direction of the trend.
1 year ago
Pending
Fibonacci levels can be used to identify potential entry points for trades. After a retracement, when momentum candles or chart patterns confirm the direction, a trade can be taken in alignment with the trend.
So Fibonacci point and also explains how to take trades. Let's say market up, Fibonacci will tell you that when it came down, it will go up from here. As soon as you know the Fibonacci level, in a particular movement, you get momentum candles, you get a particular chart pattern, from there you can take a trade in the up direction, in the direction of the trend.
Pending
During significant market movements (uptrend or downtrend), reversals are expected to occur around Fibonacci levels 0.618 and 0.786.
And when there are big movements When you are getting to see big movements in the market You 0.382 When there is an uptrend in this direction in the market or a downtrend in this direction, then the reversals that you will see will be seen from 0.618 and 0.786.
1 year ago
Pending
During significant market movements (uptrend or downtrend), reversals are expected to occur around Fibonacci levels 0.618 and 0.786.
And when there are big movements When you are getting to see big movements in the market You 0.382 When there is an uptrend in this direction in the market or a downtrend in this direction, then the reversals that you will see will be seen from 0.618 and 0.786.
Pending
In strong uptrends or downtrends where the market moves very fast, reversals are likely to occur at Fibonacci levels 0.236 and 0.382.
When there is a strong upward movement Means when the market is going up very fast Or when the market is going down very fast Then always the reversals that will come That will be in from 0.236 and 0.382
1 year ago
Pending
In strong uptrends or downtrends where the market moves very fast, reversals are likely to occur at Fibonacci levels 0.236 and 0.382.
When there is a strong upward movement Means when the market is going up very fast Or when the market is going down very fast Then always the reversals that will come That will be in from 0.236 and 0.382
Pending
If market trends, after moving upwards, break through specific Fibonacci levels (1, 2, 3, 4), it indicates a potential reversal of the trend.
Or if the market is going downward, and we took it up. 1 break, 2 break, 3 break, 4 break, then break, so it means the market can reverse and go now.
1 year ago
Pending
If market trends, after moving upwards, break through specific Fibonacci levels (1, 2, 3, 4), it indicates a potential reversal of the trend.
Or if the market is going downward, and we took it up. 1 break, 2 break, 3 break, 4 break, then break, so it means the market can reverse and go now.
Pending
If Fibonacci levels 0.2, 0.3, 0.5, 0.6, or 0.7 are broken, it signals a potential trend reversal, indicating the retracement is over and the market will move in the opposite direction of the prior trend.
And as soon as it breaks four numbers. We talked about five numbers. That is 0.2, 0.3, 0.5, 0.6 and 0.7. So as soon as it breaks 0.6. It has broken 0.6. This means that there is a chance of a reversal. Retracement is over. Instead of going upward, the market will continue down.
1 year ago
Pending
If Fibonacci levels 0.2, 0.3, 0.5, 0.6, or 0.7 are broken, it signals a potential trend reversal, indicating the retracement is over and the market will move in the opposite direction of the prior trend.
And as soon as it breaks four numbers. We talked about five numbers. That is 0.2, 0.3, 0.5, 0.6 and 0.7. So as soon as it breaks 0.6. It has broken 0.6. This means that there is a chance of a reversal. Retracement is over. Instead of going upward, the market will continue down.
Pending
Beginners in forex trading will need to use leverage, even with small initial capital like $100, to trade meaningfully and afford micro lots.
I wouldn't suggest trading without leverage because if you want to trade in forex, it's very important to have a large capital. You can't just invest a large capital. If you want to invest as a beginner, you'll invest $100, which means you'll invest around 10,000 Indian dollars (Indian Rupees). You won't be able to trade millions with $10,000. And you'll also have to buy micro lots, which will be a significant amount. So, you'll have to use leverage.
1 year ago
Pending
Beginners in forex trading will need to use leverage, even with small initial capital like $100, to trade meaningfully and afford micro lots.
I wouldn't suggest trading without leverage because if you want to trade in forex, it's very important to have a large capital. You can't just invest a large capital. If you want to invest as a beginner, you'll invest $100, which means you'll invest around 10,000 Indian dollars (Indian Rupees). You won't be able to trade millions with $10,000. And you'll also have to buy micro lots, which will be a significant amount. So, you'll have to use leverage.
Pending
Taking leverage above 50x (e.g., 1:2000, 1:1888) is considered too risky, and traders should not exceed 1:50 leverage, or at most 1:150.
if you take more than that then you are taking a more risky trade and you are also putting your capital at risk, you can also say that you are stretching your legs beyond the blanket, 1 means 50 times, okay if it is $ then you can take a trade of $50, you have to take only this much leverage, if we look at the options here, we can also get 1:2000, 1:1 888, you don't have to go that far, what you have to do is not take leverage above 150
1 year ago
Pending
Taking leverage above 50x (e.g., 1:2000, 1:1888) is considered too risky, and traders should not exceed 1:50 leverage, or at most 1:150.
if you take more than that then you are taking a more risky trade and you are also putting your capital at risk, you can also say that you are stretching your legs beyond the blanket, 1 means 50 times, okay if it is $ then you can take a trade of $50, you have to take only this much leverage, if we look at the options here, we can also get 1:2000, 1:1 888, you don't have to go that far, what you have to do is not take leverage above 150
Pending
Good forex brokers offer leverage up to 500x or 2000x, but traders are advised to use leverage up to 50x only to manage risk.
good brokers give you leverage up to 500 or 2000, not more than that but I would suggest that if you have to use leverage then you should use leverage up to 50 times only
1 year ago
Pending
Good forex brokers offer leverage up to 500x or 2000x, but traders are advised to use leverage up to 50x only to manage risk.
good brokers give you leverage up to 500 or 2000, not more than that but I would suggest that if you have to use leverage then you should use leverage up to 50 times only
Pending
Beginners in forex trading should not trade without leverage, as it's crucial for trading larger positions with a small initial capital (e.g., $100 or ₹10,000) and to trade micro lots effectively.
Should a beginner trade without leverage? I wouldn't suggest trading without leverage because if you want to trade in forex, it's very important to have a large capital. You can't just invest a large capital. If you want to invest as a beginner, you'll invest $100, which means you'll invest around 10,000 Indian dollars (Indian Rupees). You won't be able to trade millions with $10,000. And you'll also have to buy micro lots, which will be a significant amount. So, you'll have to use leverage. At the end, okay
1 year ago
Pending
Beginners in forex trading should not trade without leverage, as it's crucial for trading larger positions with a small initial capital (e.g., $100 or ₹10,000) and to trade micro lots effectively.
Should a beginner trade without leverage? I wouldn't suggest trading without leverage because if you want to trade in forex, it's very important to have a large capital. You can't just invest a large capital. If you want to invest as a beginner, you'll invest $100, which means you'll invest around 10,000 Indian dollars (Indian Rupees). You won't be able to trade millions with $10,000. And you'll also have to buy micro lots, which will be a significant amount. So, you'll have to use leverage. At the end, okay
Pending
Using leverage beyond 50x in forex trading is considered a risky trade that puts capital at risk.
I would suggest that if you have to use leverage then you should use leverage up to 50 times only, if you take more than that then you are taking a more risky trade and you are also putting your capital at risk
1 year ago
Pending
Using leverage beyond 50x in forex trading is considered a risky trade that puts capital at risk.
I would suggest that if you have to use leverage then you should use leverage up to 50 times only, if you take more than that then you are taking a more risky trade and you are also putting your capital at risk
Pending
Leverage options up to 1:2000 exist, but it is advised not to exceed 1:50 leverage.
if we look at the options here, we can also get 1:2000, 1: 888, you don't have to go that far, what you have to do is not take leverage above 150
1 year ago
Pending
Leverage options up to 1:2000 exist, but it is advised not to exceed 1:50 leverage.
if we look at the options here, we can also get 1:2000, 1: 888, you don't have to go that far, what you have to do is not take leverage above 150
Pending
Good forex brokers offer leverage up to 500x or 2000x, but traders should only use up to 50x leverage.
good brokers give you leverage up to 500 or 2000, not more than that but I would suggest that if you have to use leverage then you should use leverage up to 50 times only
1 year ago
Pending
Good forex brokers offer leverage up to 500x or 2000x, but traders should only use up to 50x leverage.
good brokers give you leverage up to 500 or 2000, not more than that but I would suggest that if you have to use leverage then you should use leverage up to 50 times only
Pending
Good forex brokers offer leverage up to 500x or 2000x. However, it is suggested to use leverage up to 50x.
good brokers give you leverage up to 500 or 2000, not more than that but I would suggest that if you have to use leverage then you should use leverage up to 50 times only
1 year ago
Pending
Good forex brokers offer leverage up to 500x or 2000x. However, it is suggested to use leverage up to 50x.
good brokers give you leverage up to 500 or 2000, not more than that but I would suggest that if you have to use leverage then you should use leverage up to 50 times only
Pending
Beginners in forex trading are advised to use leverage, as it is crucial for trading with substantial capital.
Should a beginner trade without leverage? I wouldn't suggest trading without leverage because if you want to trade in forex, it's very important to have a large capital.
1 year ago
Pending
Beginners in forex trading are advised to use leverage, as it is crucial for trading with substantial capital.
Should a beginner trade without leverage? I wouldn't suggest trading without leverage because if you want to trade in forex, it's very important to have a large capital.
Pending
Do not take leverage above 150x in forex trading.
what you have to do is not take leverage above 150
1 year ago
Pending
Do not take leverage above 150x in forex trading.
what you have to do is not take leverage above 150
Pending
It is recommended not to use leverage above 150x in forex trading.
what you have to do is not take leverage above 150
1 year ago
Pending
It is recommended not to use leverage above 150x in forex trading.
what you have to do is not take leverage above 150
Pending
Good forex brokers offer leverage up to 500x or 2000x, but it's recommended to use leverage up to 50x only.
good brokers give you leverage up to 500 or 2000, not more than that but I would suggest that if you have to use leverage then you should use leverage up to 50 times only
1 year ago
Pending
Good forex brokers offer leverage up to 500x or 2000x, but it's recommended to use leverage up to 50x only.
good brokers give you leverage up to 500 or 2000, not more than that but I would suggest that if you have to use leverage then you should use leverage up to 50 times only
Pending
Using leverage above 50x in forex trading is considered high-risk and puts capital at significant risk.
I would suggest that if you have to use leverage then you should use leverage up to 50 times only, if you take more than that then you are taking a more risky trade and you are also putting your capital at risk
1 year ago
Pending
Using leverage above 50x in forex trading is considered high-risk and puts capital at significant risk.
I would suggest that if you have to use leverage then you should use leverage up to 50 times only, if you take more than that then you are taking a more risky trade and you are also putting your capital at risk
Pending
Good forex brokers offer leverage up to 2000x, but traders should ideally use leverage up to 50x to manage risk.
good brokers give you leverage up to 500 or 2000, not more than that but I would suggest that if you have to use leverage then you should use leverage up to 50 times only
1 year ago
Pending
Good forex brokers offer leverage up to 2000x, but traders should ideally use leverage up to 50x to manage risk.
good brokers give you leverage up to 500 or 2000, not more than that but I would suggest that if you have to use leverage then you should use leverage up to 50 times only
Pending
Reiterates the short selling process: sell first, then buy back at a lower price to profit from the decrease.
Short selling, short selling, sell first. ... if its price decreases, say, if I reached 80, then I sold it then. If he had bought it again, I would have made a profit.
1 year ago
Pending
Reiterates the short selling process: sell first, then buy back at a lower price to profit from the decrease.
Short selling, short selling, sell first. ... if its price decreases, say, if I reached 80, then I sold it then. If he had bought it again, I would have made a profit.
Pending
Clarifies that intraday trading requires closing positions within the same day, not necessarily by evening; positions can be closed earlier.
within how many days in intraday trading You have to trade intraday. You have to buy in the morning and sell by evening. You can buy during the day also, you can buy and sell an hour before. It is not necessary that you have to close in the evening only.
1 year ago
Pending
Clarifies that intraday trading requires closing positions within the same day, not necessarily by evening; positions can be closed earlier.
within how many days in intraday trading You have to trade intraday. You have to buy in the morning and sell by evening. You can buy during the day also, you can buy and sell an hour before. It is not necessary that you have to close in the evening only.
Pending
The speaker commits to making viewers traders, offering future courses like Price Action and comprehensive trading education.
I will soon bring the next trading course, Price Action Course, then after that, to teach you the entire trading and it is my responsibility to make you a trader.
1 year ago
Pending
The speaker commits to making viewers traders, offering future courses like Price Action and comprehensive trading education.
I will soon bring the next trading course, Price Action Course, then after that, to teach you the entire trading and it is my responsibility to make you a trader.
Pending
Future videos will include live market identification of market structure.
In that video, I'll explain that. Also, how to actually identify the market structure we just learned in live markets.
1 year ago
Pending
Future videos will include live market identification of market structure.
In that video, I'll explain that. Also, how to actually identify the market structure we just learned in live markets.
Pending
The next video will cover comparisons of options, swing, and intraday trading, followed by live market practice.
The next video, I'll explain all these things to you: options trading vs. swing trading vs. intraday trading. After that, we'll try intraday trading on actual charts and in live markets.
1 year ago
Pending
The next video will cover comparisons of options, swing, and intraday trading, followed by live market practice.
The next video, I'll explain all these things to you: options trading vs. swing trading vs. intraday trading. After that, we'll try intraday trading on actual charts and in live markets.
Pending
The speaker has compiled essential chart and candlestick patterns into free video resources.
compiled all the best of the best important chart patterns and candlestick patterns for you.
1 year ago
Pending
The speaker has compiled essential chart and candlestick patterns into free video resources.
compiled all the best of the best important chart patterns and candlestick patterns for you.
Pending
A free course on candlestick patterns is also available in the description for beginners.
if you people do not know much about candlesticks, what are candlesticks, how to trade on them, what are candlestick patterns, then you will also find a course on chart patterns in the description, you will also get a course on candlestick patterns
1 year ago
Pending
A free course on candlestick patterns is also available in the description for beginners.
if you people do not know much about candlesticks, what are candlesticks, how to trade on them, what are candlestick patterns, then you will also find a course on chart patterns in the description, you will also get a course on candlestick patterns
Pending
The speaker offers a free, comprehensive course on chart patterns, available via a link in the description.
if you want to learn all the chart patterns in detail, if you want to learn technical analysis, then you will see a video in the 'Aay' button, or I have given a link to a video in the description, that is my complete chart patterns course
1 year ago
Pending
The speaker offers a free, comprehensive course on chart patterns, available via a link in the description.
if you want to learn all the chart patterns in detail, if you want to learn technical analysis, then you will see a video in the 'Aay' button, or I have given a link to a video in the description, that is my complete chart patterns course
Pending
Mentions other chart patterns like Head and Shoulders in addition to Double Top and Double Bottom.
The M pattern is a W pattern, then after that, the D and Shoulder patterns, then there are many patterns
1 year ago
Pending
Mentions other chart patterns like Head and Shoulders in addition to Double Top and Double Bottom.
The M pattern is a W pattern, then after that, the D and Shoulder patterns, then there are many patterns
Pending
States that the Double Bottom pattern is the inverse of the Double Top pattern.
Double top or M pattern is called its exact opposite if it is in the market.
1 year ago
Pending
States that the Double Bottom pattern is the inverse of the Double Top pattern.
Double top or M pattern is called its exact opposite if it is in the market.
Pending
If the video reaches 10,000 likes, the speaker will soon release the next course, a Price Action Course, and takes responsibility for making viewers into traders.
Like this video and complete it with 10,000 likes. I will soon bring the next trading course, Price Action Course, then after that, to teach you the entire trading and it is my responsibility to make you a trader.
1 year ago
Pending
If the video reaches 10,000 likes, the speaker will soon release the next course, a Price Action Course, and takes responsibility for making viewers into traders.
Like this video and complete it with 10,000 likes. I will soon bring the next trading course, Price Action Course, then after that, to teach you the entire trading and it is my responsibility to make you a trader.
Pending
Short selling involves selling an asset first, then buying it back at a lower price to profit from the price decrease.
Short selling, short selling, sell first. Okay, yes, I understood, yes, I understood, sell first. Yes, then if its price decreases, say, if I reached 80, then I sold it then. If he had bought it again, I would have made a profit. I made a profit.
1 year ago
Pending
Short selling involves selling an asset first, then buying it back at a lower price to profit from the price decrease.
Short selling, short selling, sell first. Okay, yes, I understood, yes, I understood, sell first. Yes, then if its price decreases, say, if I reached 80, then I sold it then. If he had bought it again, I would have made a profit. I made a profit.
Pending
Identifies Double Top (M pattern) and Double Bottom (W pattern) as key chart patterns for intraday trading.
the first is the double top, followed by the double bottom. The double top is also called the M pattern. Double bottom is also called W pattern.
1 year ago
Pending
Identifies Double Top (M pattern) and Double Bottom (W pattern) as key chart patterns for intraday trading.
the first is the double top, followed by the double bottom. The double top is also called the M pattern. Double bottom is also called W pattern.
Pending
A disadvantage of intraday trading is that if a position is not closed by the end of the day, it is automatically closed by the broker, potentially leading to losses if the price has fallen and the trader cannot hold for recovery.
Intraday trading means if you buy in the morning, suppose I bought for ₹100 and its price increases by evening, then I will have to make that much higher payout. I said loss. Loss means my 100 kali, by evening it means that I bought for ₹100 and if its price does not increase or falls, even then that position will automatically close.
1 year ago
Pending
A disadvantage of intraday trading is that if a position is not closed by the end of the day, it is automatically closed by the broker, potentially leading to losses if the price has fallen and the trader cannot hold for recovery.
Intraday trading means if you buy in the morning, suppose I bought for ₹100 and its price increases by evening, then I will have to make that much higher payout. I said loss. Loss means my 100 kali, by evening it means that I bought for ₹100 and if its price does not increase or falls, even then that position will automatically close.
Pending
Introduces the topic of important chart patterns for intraday trading.
What are the best patterns for intraday trading?
1 year ago
Pending
Introduces the topic of important chart patterns for intraday trading.
What are the best patterns for intraday trading?
Pending
Shows how 5x margin amplifies profits: a 10-point rise in a stock can yield a 10,000 profit on a 10,000 invested amount.
if you make a profit at ₹10, then in normal trading, you will have a profit of ₹2000. But in intraday trading, if you trade with 5x margin, then you will have a profit of ₹10000.
1 year ago
Pending
Shows how 5x margin amplifies profits: a 10-point rise in a stock can yield a 10,000 profit on a 10,000 invested amount.
if you make a profit at ₹10, then in normal trading, you will have a profit of ₹2000. But in intraday trading, if you trade with 5x margin, then you will have a profit of ₹10000.
Pending
Intraday trades involve buying and selling within the same day, not necessarily closing only in the evening; trades can be closed earlier in the day.
within how many days in intraday trading You have to trade intraday. You have to buy in the morning and sell by evening. You can buy during the day also, you can buy and sell an hour before. It is not necessary that you have to close in the evening only.
1 year ago
Pending
Intraday trades involve buying and selling within the same day, not necessarily closing only in the evening; trades can be closed earlier in the day.
within how many days in intraday trading You have to trade intraday. You have to buy in the morning and sell by evening. You can buy during the day also, you can buy and sell an hour before. It is not necessary that you have to close in the evening only.
Pending
In intraday trading, a 5x margin is available, allowing traders to trade with an amount five times their account balance.
what all have we learned, so how much is the margin intraday trading, so how much is the margin, with in intraday trading, so how much is the margin, with what amount can you trade, there is 5x 5x margin, okay,
1 year ago
Pending
In intraday trading, a 5x margin is available, allowing traders to trade with an amount five times their account balance.
what all have we learned, so how much is the margin intraday trading, so how much is the margin, with in intraday trading, so how much is the margin, with what amount can you trade, there is 5x 5x margin, okay,
Pending
A sideways market is characterized by prices fluctuating within a range, forming roughly equal highs and equal lows.
And if we talk about a sideways market, there's usually a concept called equal highs and equal lows. What does this mean? The highs and lows the market is making are usually around equal. This is how we see a sideways market.
1 year ago
Pending
A sideways market is characterized by prices fluctuating within a range, forming roughly equal highs and equal lows.
And if we talk about a sideways market, there's usually a concept called equal highs and equal lows. What does this mean? The highs and lows the market is making are usually around equal. This is how we see a sideways market.
Pending
Demonstrates how 5x margin amplifies losses: a 10-point drop in a stock can result in a 5,000 loss on a 10,000 invested amount.
at the same time, you incurred a loss at ₹10, but this time you used 5x margin. In intraday trading, now you will incur a loss of ₹50,0000 at ₹10, which means the loss will be ₹5,000.
1 year ago
Pending
Demonstrates how 5x margin amplifies losses: a 10-point drop in a stock can result in a 5,000 loss on a 10,000 invested amount.
at the same time, you incurred a loss at ₹10, but this time you used 5x margin. In intraday trading, now you will incur a loss of ₹50,0000 at ₹10, which means the loss will be ₹5,000.
Pending
A downtrend is characterized by the market moving downwards, forming lower highs and lower lows.
Now what happens in a down trend, the market comes down in this manner. Now see, here this is the high, this is the low, what happens in this, the market comes down with lower highs and lower lows, lower highs. Lower lows, lower highs. Then lower lows, lower lows.
1 year ago
Pending
A downtrend is characterized by the market moving downwards, forming lower highs and lower lows.
Now what happens in a down trend, the market comes down in this manner. Now see, here this is the high, this is the low, what happens in this, the market comes down with lower highs and lower lows, lower highs. Lower lows, lower highs. Then lower lows, lower lows.
Pending
A 'lower low' in market structure occurs when a new trough in price is lower than the previous trough.
and if in these cases, like here, if you see, this is the low of this In comparison, this one which is low is below, its straight line, see the straight line is going like this and this one which is the next low, is below the previous low, okay so this becomes lower low, okay lower low, so higher L, so we have learnt what comes after L, now see in L comes A L that is higher low and L L that is lower low,
1 year ago
Pending
A 'lower low' in market structure occurs when a new trough in price is lower than the previous trough.
and if in these cases, like here, if you see, this is the low of this In comparison, this one which is low is below, its straight line, see the straight line is going like this and this one which is the next low, is below the previous low, okay so this becomes lower low, okay lower low, so higher L, so we have learnt what comes after L, now see in L comes A L that is higher low and L L that is lower low,
Pending
With 10,000 in an account and 5x leverage, a trader can execute trades worth up to 50,000.
if you have 10000 in your account, ... you can trade shares from ₹50000 to ₹50000 only.
1 year ago
Pending
With 10,000 in an account and 5x leverage, a trader can execute trades worth up to 50,000.
if you have 10000 in your account, ... you can trade shares from ₹50000 to ₹50000 only.
Pending
Explains that 5x margin in intraday trading allows a trader to control assets worth five times their account balance.
5x margin is nothing, let's say for example, in your account, if you use a trading account like Zerodha... if you have 10000 in your account, ... you have a margin of up to 5x in intraday trading
1 year ago
Pending
Explains that 5x margin in intraday trading allows a trader to control assets worth five times their account balance.
5x margin is nothing, let's say for example, in your account, if you use a trading account like Zerodha... if you have 10000 in your account, ... you have a margin of up to 5x in intraday trading
Pending
A 'higher low' in market structure occurs when a new trough in price is higher than the previous trough.
now see, here was the first point, one minute, the first point, this became the lower point, now see, in comparison to this, the next low is a little higher, so we will call it higher low, okay, again if the low is above the next one, then it will become higher low, once again it will become higher low, if again the low is above, then it will become higher low,
1 year ago
Pending
A 'higher low' in market structure occurs when a new trough in price is higher than the previous trough.
now see, here was the first point, one minute, the first point, this became the lower point, now see, in comparison to this, the next low is a little higher, so we will call it higher low, okay, again if the low is above the next one, then it will become higher low, once again it will become higher low, if again the low is above, then it will become higher low,
Pending
Illustrates how a shift in market structure allows for profitable short selling, selling at a higher price (110) and buying back at a lower price (80).
The market structure has shifted. When will you make a profit? When will you sell here? You will do it, okay, you sold it at 110, then when it came to 80, you bought it, so what did you do, in a way, you sold it at ₹110, bought it at 80, so you made a profit of ₹30 on ₹110
1 year ago
Pending
Illustrates how a shift in market structure allows for profitable short selling, selling at a higher price (110) and buying back at a lower price (80).
The market structure has shifted. When will you make a profit? When will you sell here? You will do it, okay, you sold it at 110, then when it came to 80, you bought it, so what did you do, in a way, you sold it at ₹110, bought it at 80, so you made a profit of ₹30 on ₹110
Pending
A 'lower high' in market structure occurs when a new peak in price is lower than the previous peak.
if the next high comes below this, say from 110, say it comes at 105, the next high comes at 105, then we will call it lower high, okay, LH means lower high,
1 year ago
Pending
A 'lower high' in market structure occurs when a new peak in price is lower than the previous peak.
if the next high comes below this, say from 110, say it comes at 105, the next high comes at 105, then we will call it lower high, okay, LH means lower high,
Pending
Describes the formation of a double bottom pattern, characterized by two lows at similar price levels.
if the market is going like this, like this, like this, ... Then after that, the market came down, one, two, see here, these are two bottoms, meaning there are two lows, both the lows are at the same level
1 year ago
Pending
Describes the formation of a double bottom pattern, characterized by two lows at similar price levels.
if the market is going like this, like this, like this, ... Then after that, the market came down, one, two, see here, these are two bottoms, meaning there are two lows, both the lows are at the same level
Pending
A 'higher high' in market structure occurs when a new peak in price is higher than the previous peak.
HH means higher high, what does higher high mean, like here the first high is at ₹100, okay now if we look at the next high, 110, then it is above 100, 100 Above means it became 110, if it was 90 then it would have been below, correct it is above 100, so if the next high is above the previous high then we will call it higher high, okay so this will not become a simple H, it will become a higher high, okay and after this, if the next high after 110, the next upper point, is formed above this, then we will call it again higher high, okay because now see, from 110 it became 115, so this is again higher high,
1 year ago
Pending
A 'higher high' in market structure occurs when a new peak in price is higher than the previous peak.
HH means higher high, what does higher high mean, like here the first high is at ₹100, okay now if we look at the next high, 110, then it is above 100, 100 Above means it became 110, if it was 90 then it would have been below, correct it is above 100, so if the next high is above the previous high then we will call it higher high, okay so this will not become a simple H, it will become a higher high, okay and after this, if the next high after 110, the next upper point, is formed above this, then we will call it again higher high, okay because now see, from 110 it became 115, so this is again higher high,
Pending
Confirms an uptrend based on the market's upward movement and the formation of higher highs.
when the market is going up, let's do one thing, let's do a little better drawing. ... This is an uptrend because the market is moving upwards. Now here do you see the second high here in comparison to the high? This is a higher high.
1 year ago
Pending
Confirms an uptrend based on the market's upward movement and the formation of higher highs.
when the market is going up, let's do one thing, let's do a little better drawing. ... This is an uptrend because the market is moving upwards. Now here do you see the second high here in comparison to the high? This is a higher high.
Pending
Reiterates that a downtrend is identified by lower highs and lower lows.
in a downtrend, the market comes down by making lower highs and lower lows.
1 year ago
Pending
Reiterates that a downtrend is identified by lower highs and lower lows.
in a downtrend, the market comes down by making lower highs and lower lows.
Pending
An uptrend is characterized by higher highs and higher lows. The lows in an uptrend progressively move higher (e.g., 80, 90, 95), and the highs also move higher (e.g., 100, 110, 115).
Now, an uptrend has a structure. The structure of an uptrend will be something like this. Now, I wrote something above that was HHHL. Now, look at any lowest point in the market, let me give you an example. If there is a stock, it starts at 80, okay, it went up to 100, then came down to 90, then went up to 110, then came down to 95, then went up to 115. Okay, so any low point in the market, like it reached 80, then 90, then 95, we call these lows. These are called the lows of the market and these upper points 100 110 115 we call them highs in the market, understood this much,
1 year ago
Pending
An uptrend is characterized by higher highs and higher lows. The lows in an uptrend progressively move higher (e.g., 80, 90, 95), and the highs also move higher (e.g., 100, 110, 115).
Now, an uptrend has a structure. The structure of an uptrend will be something like this. Now, I wrote something above that was HHHL. Now, look at any lowest point in the market, let me give you an example. If there is a stock, it starts at 80, okay, it went up to 100, then came down to 90, then went up to 110, then came down to 95, then went up to 115. Okay, so any low point in the market, like it reached 80, then 90, then 95, we call these lows. These are called the lows of the market and these upper points 100 110 115 we call them highs in the market, understood this much,
Pending
Defines an uptrend as characterized by the market making higher highs and higher lows.
in an uptrend, the market will go up with higher highs and higher lows
1 year ago
Pending
Defines an uptrend as characterized by the market making higher highs and higher lows.
in an uptrend, the market will go up with higher highs and higher lows
Pending
An uptrend is defined as a market where prices are generally moving upwards.
One is an upward structure, which I will explain first. So that is an uptrend. This video is for beginners, by the way, those who are just learning. So, because this friend of mine is a beginner who needs to completely understand the market, what happens, how it works. That is why, now look, if the market is moving upwards, we call it an uptrend.
1 year ago
Pending
An uptrend is defined as a market where prices are generally moving upwards.
One is an upward structure, which I will explain first. So that is an uptrend. This video is for beginners, by the way, those who are just learning. So, because this friend of mine is a beginner who needs to completely understand the market, what happens, how it works. That is why, now look, if the market is moving upwards, we call it an uptrend.
Pending
The market moves in 'pulses' or 'waves' rather than in straight lines.
The market always moves in pulses, or what we call waves, so people will understand it more easily. It moves in waves or pulses.
1 year ago
Pending
The market moves in 'pulses' or 'waves' rather than in straight lines.
The market always moves in pulses, or what we call waves, so people will understand it more easily. It moves in waves or pulses.
Pending
A simple method for selecting intraday stocks is to identify top gainers (stocks that have risen the most) and top losers (stocks that have fallen the most), though caution is advised as some stocks might reverse their trend.
The next thing for intraday trading, one of the simplest methods, is to find top gainers and top losers. Every day, there's something called a top gainer. I've heard it every day. I mean, of all the stocks in the market, which stock is performing well today? In small caps, mid caps, large caps, which stock rose the most? Which stock fell the most? These are called top gainers. The top gainers that rose the most? The top losers that fell the most. Okay, but you have to be careful. Some stocks have already gone very high, we think they will go higher, but they reverse. So, you can also trade using the top gainers and top losers method, but with a little bit of caution.
1 year ago
Pending
A simple method for selecting intraday stocks is to identify top gainers (stocks that have risen the most) and top losers (stocks that have fallen the most), though caution is advised as some stocks might reverse their trend.
The next thing for intraday trading, one of the simplest methods, is to find top gainers and top losers. Every day, there's something called a top gainer. I've heard it every day. I mean, of all the stocks in the market, which stock is performing well today? In small caps, mid caps, large caps, which stock rose the most? Which stock fell the most? These are called top gainers. The top gainers that rose the most? The top losers that fell the most. Okay, but you have to be careful. Some stocks have already gone very high, we think they will go higher, but they reverse. So, you can also trade using the top gainers and top losers method, but with a little bit of caution.
Pending
Describes a sideways market as one with roughly equal highs and equal lows.
if we talk about a sideways market, there's usually a concept called equal highs and equal lows.
1 year ago
Pending
Describes a sideways market as one with roughly equal highs and equal lows.
if we talk about a sideways market, there's usually a concept called equal highs and equal lows.
Pending
Stocks can be selected based on breakouts (price moving above a resistance level) and breakdowns (price moving below a support level). Breakouts often trigger further price increases due to FOMO (fear of missing out).
Then after this, the next method is that it is based on breakouts and breakdowns. Breakout in the market means, for example, there is a stock which is usually always moving between 80 and 100, okay, 80, 90, 85, then again 95. Then it never broke 90, then 85, then 100, 100, 100, 100, and today finally it broke 100 for the first time in a month, a year, or a week. This is what we call a breakout. Whenever there is a breakout, people have this fear of missing out that this stock is running high, let's invest, and as people keep investing, the stock keeps running higher, so this is called a breakout. If a stock gives a breakout in the upward direction, that is, if its price keeps rising, then it is called a breakout. And if, as I said, it was moving between 80 and 100, it was not going below 80. Today, if it breaks below 80, then it is called a breakdown. So, you can also select stocks on the basis of breakouts and breakdowns.
1 year ago
Pending
Stocks can be selected based on breakouts (price moving above a resistance level) and breakdowns (price moving below a support level). Breakouts often trigger further price increases due to FOMO (fear of missing out).
Then after this, the next method is that it is based on breakouts and breakdowns. Breakout in the market means, for example, there is a stock which is usually always moving between 80 and 100, okay, 80, 90, 85, then again 95. Then it never broke 90, then 85, then 100, 100, 100, 100, and today finally it broke 100 for the first time in a month, a year, or a week. This is what we call a breakout. Whenever there is a breakout, people have this fear of missing out that this stock is running high, let's invest, and as people keep investing, the stock keeps running higher, so this is called a breakout. If a stock gives a breakout in the upward direction, that is, if its price keeps rising, then it is called a breakout. And if, as I said, it was moving between 80 and 100, it was not going below 80. Today, if it breaks below 80, then it is called a breakdown. So, you can also select stocks on the basis of breakouts and breakdowns.
Pending
Defines a downtrend as characterized by the market making lower highs and lower lows.
in a downtrend, the market comes down with lower highs and lower lows
1 year ago
Pending
Defines a downtrend as characterized by the market making lower highs and lower lows.
in a downtrend, the market comes down with lower highs and lower lows
Pending
Explains the transition from an uptrend to a downtrend involves breaking higher highs and higher lows.
Whenever the market is going in an up trend, what will it do to come in a down trend? It will break the higher highs and higher lows. Now we will simply understand what a down trend is.
1 year ago
Pending
Explains the transition from an uptrend to a downtrend involves breaking higher highs and higher lows.
Whenever the market is going in an up trend, what will it do to come in a down trend? It will break the higher highs and higher lows. Now we will simply understand what a down trend is.
Pending
Stock selection can also be based on a trader's specific strategy, such as trading around trend lines, support/resistance levels, or when a stock breaks a moving average.
Then the next method is that it is based on your strategy. What is your strategy? For example, if you trade according to trend lines, support and resistance, or moving averages, you should n't do it based on just one thing. But if you trade on such a thing, then you have to see that if it breaks the moving average, then I will trade there. If you have such a setup, then simply go and apply that moving average and look at every chart.
1 year ago
Pending
Stock selection can also be based on a trader's specific strategy, such as trading around trend lines, support/resistance levels, or when a stock breaks a moving average.
Then the next method is that it is based on your strategy. What is your strategy? For example, if you trade according to trend lines, support and resistance, or moving averages, you should n't do it based on just one thing. But if you trade on such a thing, then you have to see that if it breaks the moving average, then I will trade there. If you have such a setup, then simply go and apply that moving average and look at every chart.
Pending
Defines a 'Lower Low' in market structure: a trough price that is lower than the previous trough price.
if the next low is below the previous low, okay so this becomes lower low, okay lower low
1 year ago
Pending
Defines a 'Lower Low' in market structure: a trough price that is lower than the previous trough price.
if the next low is below the previous low, okay so this becomes lower low, okay lower low
Pending
Stocks can be selected based on sector performance. If a particular sector (e.g., banking, IT) is experiencing a 'bull run' or performing well on a given day, stocks within that sector become potential intraday trading candidates.
That is according to the sector. What does sector mean? Like there is banking sector, agriculture sector, pharmaceutical sector or medicine sector. In simple words, then apart from this, there is IT sector. So, if any sector is in a good bull run or today, say the banking sector is performing well, okay, banks are performing well today. SBI is good. HDFCfund.com is doing well today
1 year ago
Pending
Stocks can be selected based on sector performance. If a particular sector (e.g., banking, IT) is experiencing a 'bull run' or performing well on a given day, stocks within that sector become potential intraday trading candidates.
That is according to the sector. What does sector mean? Like there is banking sector, agriculture sector, pharmaceutical sector or medicine sector. In simple words, then apart from this, there is IT sector. So, if any sector is in a good bull run or today, say the banking sector is performing well, okay, banks are performing well today. SBI is good. HDFCfund.com is doing well today
Pending
A method for stock selection involves identifying 20-40 large-cap companies and then analyzing their chart patterns to determine potential trading opportunities.
Make some criteria. Write down the first number. We have to take out 20 or 30 numbers of large cap companies or 20 to 40. Now what do we have to do in that 20 or 40? We have to go and look at the chart pattern of each one. We have to study the chart. In which do we feel that the market can go up from here? In which do we feel that the market can break? All this will be understood through chart pattern. I will explain the chart pattern to you a little further.
1 year ago
Pending
A method for stock selection involves identifying 20-40 large-cap companies and then analyzing their chart patterns to determine potential trading opportunities.
Make some criteria. Write down the first number. We have to take out 20 or 30 numbers of large cap companies or 20 to 40. Now what do we have to do in that 20 or 40? We have to go and look at the chart pattern of each one. We have to study the chart. In which do we feel that the market can go up from here? In which do we feel that the market can break? All this will be understood through chart pattern. I will explain the chart pattern to you a little further.
Pending
Defines a 'Lower High' in market structure: a peak price that is lower than the previous peak price.
if the next high comes below this, say from 110, say it comes at 105, then we will call it lower high, okay, LH means lower high
1 year ago
Pending
Defines a 'Lower High' in market structure: a peak price that is lower than the previous peak price.
if the next high comes below this, say from 110, say it comes at 105, then we will call it lower high, okay, LH means lower high
Pending
Chart patterns can be used to select stocks for intraday trading by identifying companies with favorable patterns that indicate potential upward or downward price movements.
Another way to select stocks for intraday trading is by looking at chart patterns. What you need to do in the market is to look for different companies and good companies. Reliance 1. You have to study each one of them, which ones are good. In which ones do you see a good chart pattern, that the market can go up from here or down from here. So, you can sort out those companies. You have to take it out and you can trade in them.
1 year ago
Pending
Chart patterns can be used to select stocks for intraday trading by identifying companies with favorable patterns that indicate potential upward or downward price movements.
Another way to select stocks for intraday trading is by looking at chart patterns. What you need to do in the market is to look for different companies and good companies. Reliance 1. You have to study each one of them, which ones are good. In which ones do you see a good chart pattern, that the market can go up from here or down from here. So, you can sort out those companies. You have to take it out and you can trade in them.
Pending
When selecting stocks for intraday trading, avoid penny and small-cap companies. Focus on large-cap and mid-cap stocks. The speaker plans to provide a list of 100 good companies to watch in the next video.
after that you have to avoid penny companies and you have to avoid small companies, there is no such thing as small companies, I am just taking an example so that you people understand well, then after this we will talk, I have told you some rules as to how you have to select your shares or in which you have to trade, how to trade, after this I I'll also explain how to select stocks specifically for intraday trading. Now, as I've explained, whether you should select large-cap or mid-cap stocks. The first thing to keep in mind is not small-cap stocks, but mid-cap or large-cap stocks. So, you guys should go and look at large-cap companies. The companies slightly smaller than that are called mid-cap companies, and then the smallest companies are called small-cap companies. You can go and make a list of mid-cap and large-cap companies.
1 year ago
Pending
When selecting stocks for intraday trading, avoid penny and small-cap companies. Focus on large-cap and mid-cap stocks. The speaker plans to provide a list of 100 good companies to watch in the next video.
after that you have to avoid penny companies and you have to avoid small companies, there is no such thing as small companies, I am just taking an example so that you people understand well, then after this we will talk, I have told you some rules as to how you have to select your shares or in which you have to trade, how to trade, after this I I'll also explain how to select stocks specifically for intraday trading. Now, as I've explained, whether you should select large-cap or mid-cap stocks. The first thing to keep in mind is not small-cap stocks, but mid-cap or large-cap stocks. So, you guys should go and look at large-cap companies. The companies slightly smaller than that are called mid-cap companies, and then the smallest companies are called small-cap companies. You can go and make a list of mid-cap and large-cap companies.
Pending
Defines a 'Higher Low' in market structure: a trough price that is higher than the previous trough price.
if the next low is above the previous low then we will call it higher low
1 year ago
Pending
Defines a 'Higher Low' in market structure: a trough price that is higher than the previous trough price.
if the next low is above the previous low then we will call it higher low
Pending
Large-cap companies are less affected by small trades due to their immense market capitalization, whereas small-cap companies can be easily manipulated by large players, making them risky for intraday trading.
Large cap companies There are those who have shares worth billions, in simple words, there are shares worth billions, there if a company like us has two to four crore rupees or ₹20 lakh ₹1000, it does not make any difference to that company for a few hours, but small cap companies are those whose market capital is less, if the market is so big then their market is so small and in this small market, if someone wants, he can cheat you, can manipulate the market, if any big person wants, then the share price of that company can fall by 50 or can also increase it in a single day for his own benefit, so this is what small cap companies are, you have to avoid small cap companies,
1 year ago
Pending
Large-cap companies are less affected by small trades due to their immense market capitalization, whereas small-cap companies can be easily manipulated by large players, making them risky for intraday trading.
Large cap companies There are those who have shares worth billions, in simple words, there are shares worth billions, there if a company like us has two to four crore rupees or ₹20 lakh ₹1000, it does not make any difference to that company for a few hours, but small cap companies are those whose market capital is less, if the market is so big then their market is so small and in this small market, if someone wants, he can cheat you, can manipulate the market, if any big person wants, then the share price of that company can fall by 50 or can also increase it in a single day for his own benefit, so this is what small cap companies are, you have to avoid small cap companies,
Pending
Defines a 'Higher High' in market structure: a peak price that is higher than the previous peak price.
if the next high is above the previous high then we will call it higher high
1 year ago
Pending
Defines a 'Higher High' in market structure: a peak price that is higher than the previous peak price.
if the next high is above the previous high then we will call it higher high
Pending
Defines abbreviations used in market structure analysis: HH for Higher High and HL for Higher Low.
HH means Higher High, HL means Higher Low
1 year ago
Pending
Defines abbreviations used in market structure analysis: HH for Higher High and HL for Higher Low.
HH means Higher High, HL means Higher Low
Pending
Defines market structure as the way the market is moving.
Market structure means what is the structure of the market, how is the market moving
1 year ago
Pending
Defines market structure as the way the market is moving.
Market structure means what is the structure of the market, how is the market moving
Pending
Large-cap companies have the highest market capitalization (billions of crores), mid-cap companies are below them, and small-cap companies have low market capitalization (e.g., 20-100 crores). Small-cap stocks are vulnerable to manipulation as a single large trade can significantly impact their price.
So the companies which have the highest market cap in thousands of crores, when the market cap is in crores, those companies at the top come under large cap, the companies below that come under mid cap and those companies whose market cap is low come under small cap. Now what is the disadvantage of low market cap, suppose for example, if the market cap of a company is only 100 crores, let us say it is even smaller than that, say if the market cap is only 20 crores, then if someone comes there and buys or sells shares worth even 2 crores, because at 10 it becomes 20 crores, then the market can go up or down on the basis of a single person, this is the problem of small caps,
1 year ago
Pending
Large-cap companies have the highest market capitalization (billions of crores), mid-cap companies are below them, and small-cap companies have low market capitalization (e.g., 20-100 crores). Small-cap stocks are vulnerable to manipulation as a single large trade can significantly impact their price.
So the companies which have the highest market cap in thousands of crores, when the market cap is in crores, those companies at the top come under large cap, the companies below that come under mid cap and those companies whose market cap is low come under small cap. Now what is the disadvantage of low market cap, suppose for example, if the market cap of a company is only 100 crores, let us say it is even smaller than that, say if the market cap is only 20 crores, then if someone comes there and buys or sells shares worth even 2 crores, because at 10 it becomes 20 crores, then the market can go up or down on the basis of a single person, this is the problem of small caps,
Pending
Recommends identifying top gainers and top losers as a method for selecting stocks for intraday trading.
find top gainers and top losers. Every day, there's something called a top gainer.
1 year ago
Pending
Recommends identifying top gainers and top losers as a method for selecting stocks for intraday trading.
find top gainers and top losers. Every day, there's something called a top gainer.
Pending
Small-cap companies should be avoided for intraday trading. Market capitalization, which is the total value of a company's outstanding shares, defines large-cap, mid-cap, and small-cap classifications.
Small cap companies should be avoided. There are three types of caps. Cap means one thing, let me explain to you, that is market capitalization. Many people skip this point because people think that this is not teaching anything, but you need to understand the basics of the market. It is important to understand what the market is. Look, there is small cap, there is mid cap, there is large cap, which are the best companies whose market capitalization means how many shares are there and how much amount. The total amount of shares is market capitalization.
1 year ago
Pending
Small-cap companies should be avoided for intraday trading. Market capitalization, which is the total value of a company's outstanding shares, defines large-cap, mid-cap, and small-cap classifications.
Small cap companies should be avoided. There are three types of caps. Cap means one thing, let me explain to you, that is market capitalization. Many people skip this point because people think that this is not teaching anything, but you need to understand the basics of the market. It is important to understand what the market is. Look, there is small cap, there is mid cap, there is large cap, which are the best companies whose market capitalization means how many shares are there and how much amount. The total amount of shares is market capitalization.
Pending
Defines breakout (upward price movement beyond resistance) and breakdown (downward price movement below support) for stock selection.
If a stock gives a breakout in the upward direction, that is, if its price keeps rising, then it is called a breakout. And if, as I said, it was moving between 80 and 100, it was not going below 80. Today, if it breaks below 80, then it is called a breakdown.
1 year ago
Pending
Defines breakout (upward price movement beyond resistance) and breakdown (downward price movement below support) for stock selection.
If a stock gives a breakout in the upward direction, that is, if its price keeps rising, then it is called a breakout. And if, as I said, it was moving between 80 and 100, it was not going below 80. Today, if it breaks below 80, then it is called a breakdown.
Pending
For intraday trading, focus on top 200 companies, avoid penny and small stocks, and trade in the direction of the prevailing trend (up or down) to minimize risk and potentially maximize gains.
Look at the top 200 companies of ₹5000000, avoid penny stocks, avoid small companies and in the good companies, it seems as if there is an up trend, the market runs up. If the market is moving, then you should look for trades in the direction in which it wants to go. That means, let's say for example, if the market is moving up, then you buy. If the market is trying to move down, then sell. There is always a saying, be the friend of the trend. It means be a friend of the trend. Do not go against it because we do not know how much the market will move up. If you start selling and if the market moves too high, then you can incur a huge loss.
1 year ago
Pending
For intraday trading, focus on top 200 companies, avoid penny and small stocks, and trade in the direction of the prevailing trend (up or down) to minimize risk and potentially maximize gains.
Look at the top 200 companies of ₹5000000, avoid penny stocks, avoid small companies and in the good companies, it seems as if there is an up trend, the market runs up. If the market is moving, then you should look for trades in the direction in which it wants to go. That means, let's say for example, if the market is moving up, then you buy. If the market is trying to move down, then sell. There is always a saying, be the friend of the trend. It means be a friend of the trend. Do not go against it because we do not know how much the market will move up. If you start selling and if the market moves too high, then you can incur a huge loss.
Pending
Stocks selected for intraday trading should have 'volatility' (referred to as 'wallet'), meaning their price moves significantly up or down, enabling profit-making opportunities, rather than moving very slowly.
there should be a wallet. Wallet means that the market should move up or down. If you want to trade in a company or buy its shares, then you will do it with the objective of making a profit. Wallet means how fast the market will go up or down. If it does not have a wallet, it means it will move up very slowly. If it is a ₹10 share, you can see that it is increasing by 20 paise in a day, only those are not volatile. Volatile means a share worth ₹1000000, sometimes
1 year ago
Pending
Stocks selected for intraday trading should have 'volatility' (referred to as 'wallet'), meaning their price moves significantly up or down, enabling profit-making opportunities, rather than moving very slowly.
there should be a wallet. Wallet means that the market should move up or down. If you want to trade in a company or buy its shares, then you will do it with the objective of making a profit. Wallet means how fast the market will go up or down. If it does not have a wallet, it means it will move up very slowly. If it is a ₹10 share, you can see that it is increasing by 20 paise in a day, only those are not volatile. Volatile means a share worth ₹1000000, sometimes
Pending
Defines a breakout in the market as a stock price moving beyond a long-standing resistance level.
Breakout in the market means, for example, there is a stock which is usually always moving between 80 and 100... And today finally it broke 100 for the first time in a month, a year, or a week. This is what we call a breakout.
1 year ago
Pending
Defines a breakout in the market as a stock price moving beyond a long-standing resistance level.
Breakout in the market means, for example, there is a stock which is usually always moving between 80 and 100... And today finally it broke 100 for the first time in a month, a year, or a week. This is what we call a breakout.
Pending
Individual trading strategies can be used to select stocks for intraday trading.
The next method is that it is based on your strategy.
1 year ago
Pending
Individual trading strategies can be used to select stocks for intraday trading.
The next method is that it is based on your strategy.
Pending
Implies that if a sector like banking is experiencing a bull run, stocks within that sector are good candidates for intraday trading.
if any sector is in a good bull run or today, say the banking sector is performing well, okay, banks are performing well today.
1 year ago
Pending
Implies that if a sector like banking is experiencing a bull run, stocks within that sector are good candidates for intraday trading.
if any sector is in a good bull run or today, say the banking sector is performing well, okay, banks are performing well today.
Pending
Liquid shares are typically from well-known companies (top 100-200) where one can buy or sell large quantities (e.g., 10,000 shares) without issue. Small companies and penny stocks should be avoided for intraday trading.
liquidity means where there is enough buying and selling that if you want to buy even 10,000 shares, there is someone to sell and if you want to sell 10,000 shares, there is someone to buy. This is called liquid shares. So, liquid shares are those which are well-known companies, top 100 companies, top 200 companies, you can trade in all these companies. In intraday trading, small companies, penny stocks or small companies, which I just mentioned like Tanmay Girlfriend Limited, you should not trade in such companies, you should avoid such companies.
1 year ago
Pending
Liquid shares are typically from well-known companies (top 100-200) where one can buy or sell large quantities (e.g., 10,000 shares) without issue. Small companies and penny stocks should be avoided for intraday trading.
liquidity means where there is enough buying and selling that if you want to buy even 10,000 shares, there is someone to sell and if you want to sell 10,000 shares, there is someone to buy. This is called liquid shares. So, liquid shares are those which are well-known companies, top 100 companies, top 200 companies, you can trade in all these companies. In intraday trading, small companies, penny stocks or small companies, which I just mentioned like Tanmay Girlfriend Limited, you should not trade in such companies, you should avoid such companies.
Pending
Stock selection for intraday trading can also be based on the performance of specific sectors.
The next method is according to which you can select the stock. That is according to the sector.
1 year ago
Pending
Stock selection for intraday trading can also be based on the performance of specific sectors.
The next method is according to which you can select the stock. That is according to the sector.
Pending
For intraday trading, stocks must be highly liquid, meaning there is consistent demand and supply, facilitating easy buying and selling without significant price impact, unlike small or 'rubbish' companies.
It should be highly liquid. What highly liquid means is that people want to buy and sell it. There is demand and supply for it. For example, if it is a rubbish company like Mohan Tanmay Girlfriend Limited, then if it is a small company, people will be interested in buying its shares, or not, they will not be interested in selling it. There should be demand and supply. One should not trade in small companies. In simple words, in all the big companies, there is demand and supply, there is buying and selling.
1 year ago
Pending
For intraday trading, stocks must be highly liquid, meaning there is consistent demand and supply, facilitating easy buying and selling without significant price impact, unlike small or 'rubbish' companies.
It should be highly liquid. What highly liquid means is that people want to buy and sell it. There is demand and supply for it. For example, if it is a rubbish company like Mohan Tanmay Girlfriend Limited, then if it is a small company, people will be interested in buying its shares, or not, they will not be interested in selling it. There should be demand and supply. One should not trade in small companies. In simple words, in all the big companies, there is demand and supply, there is buying and selling.
Pending
Suggests identifying 20-40 large-cap companies and then analyzing their chart patterns for trading opportunities.
We have to take out 20 or 30 numbers of large cap companies or 20 to 40. Now what do we have to do in that 20 or 40? We have to go and look at the chart pattern of each one.
1 year ago
Pending
Suggests identifying 20-40 large-cap companies and then analyzing their chart patterns for trading opportunities.
We have to take out 20 or 30 numbers of large cap companies or 20 to 40. Now what do we have to do in that 20 or 40? We have to go and look at the chart pattern of each one.
Pending
Chart patterns are presented as a method for selecting stocks for intraday trading.
Another way to select stocks for intraday trading is by looking at chart patterns.
1 year ago
Pending
Chart patterns are presented as a method for selecting stocks for intraday trading.
Another way to select stocks for intraday trading is by looking at chart patterns.
Pending
The primary disadvantage of short selling is the potential for unlimited losses if the price of the asset moves against the trader's expectation, as there's no theoretical upper limit to how high a stock price can rise, unlike the limited potential loss if betting on a price decrease (down to zero).
and one of the biggest disadvantages of short selling is that if the price goes against your expectations, you thought it would fall but if it increases then you can suffer a huge loss because if the price of a share, for example, is 50, at the most it can go to zero, correct at the most it will be zero, it cannot go below zero, but the price of that share can fluctuate in a day, though it should not happen and it cannot go from 50 to 500, then your loss can be huge if you do not maintain or manage stop loss etc. properly, which I will teach you in the coming videos,
1 year ago
Pending
The primary disadvantage of short selling is the potential for unlimited losses if the price of the asset moves against the trader's expectation, as there's no theoretical upper limit to how high a stock price can rise, unlike the limited potential loss if betting on a price decrease (down to zero).
and one of the biggest disadvantages of short selling is that if the price goes against your expectations, you thought it would fall but if it increases then you can suffer a huge loss because if the price of a share, for example, is 50, at the most it can go to zero, correct at the most it will be zero, it cannot go below zero, but the price of that share can fluctuate in a day, though it should not happen and it cannot go from 50 to 500, then your loss can be huge if you do not maintain or manage stop loss etc. properly, which I will teach you in the coming videos,
Pending
A significant risk in short selling is that if the price of the asset rises instead of falls, the trader must buy it back at a higher price, leading to potential substantial losses, especially if stop-loss measures are not in place.
But there's a twist: if the price doesn't fall and rises, you sold $100, but now you have to buy them back and pay them back before the end of the day. So, if that If the share becomes 200 rupees instead of 100 rupees, then you will have to buy it and return it. Understand? In short selling, you sell first and then buy it later. But yes, if you know that the price of a share is going to fall, then I am sure that my technical analysis is strong. I have analyzed that if the market falls from here, then you can sell it first. You may not even have that share, but you can sell it and buy it back later. In this way, you can reduce short selling.
1 year ago
Pending
A significant risk in short selling is that if the price of the asset rises instead of falls, the trader must buy it back at a higher price, leading to potential substantial losses, especially if stop-loss measures are not in place.
But there's a twist: if the price doesn't fall and rises, you sold $100, but now you have to buy them back and pay them back before the end of the day. So, if that If the share becomes 200 rupees instead of 100 rupees, then you will have to buy it and return it. Understand? In short selling, you sell first and then buy it later. But yes, if you know that the price of a share is going to fall, then I am sure that my technical analysis is strong. I have analyzed that if the market falls from here, then you can sell it first. You may not even have that share, but you can sell it and buy it back later. In this way, you can reduce short selling.
Pending
The speaker plans to provide a list of 100 companies to watch in the next video.
In the next video, I'll give you a good list of 100 good companies that I usually keep an eye on.
1 year ago
Pending
The speaker plans to provide a list of 100 companies to watch in the next video.
In the next video, I'll give you a good list of 100 good companies that I usually keep an eye on.
Pending
Short selling is facilitated by brokers who lend shares. The process involves selling borrowed shares first, and then buying them back at a lower price to return to the broker, generating profit if the price falls.
You sell first, okay? First, you sell 100 shells for $10,000. The price of $100 is $10,000. You bought them as soon as they reached $80. So, you sold $10,000 first, bought $8,000, and made a profit of $2,000. Now the question arises, how will this happen, brother, if you don't have shares, how will you sell them? You do n't have them. But the broker you are trading with, let's say for example, zero, the grown-up stocks, they have shares, right? So what you do is you tell them, ' I'm selling now, I'll give it back to you before the end of the day.' Okay, I'll give it back to you. So, you borrow from them, sell 100 shares first, and now when the price falls, you have to buy them back and pay them back.
1 year ago
Pending
Short selling is facilitated by brokers who lend shares. The process involves selling borrowed shares first, and then buying them back at a lower price to return to the broker, generating profit if the price falls.
You sell first, okay? First, you sell 100 shells for $10,000. The price of $100 is $10,000. You bought them as soon as they reached $80. So, you sold $10,000 first, bought $8,000, and made a profit of $2,000. Now the question arises, how will this happen, brother, if you don't have shares, how will you sell them? You do n't have them. But the broker you are trading with, let's say for example, zero, the grown-up stocks, they have shares, right? So what you do is you tell them, ' I'm selling now, I'll give it back to you before the end of the day.' Okay, I'll give it back to you. So, you borrow from them, sell 100 shares first, and now when the price falls, you have to buy them back and pay them back.
Pending
Explicitly states that mid-cap and large-cap stocks should be prioritized over small-cap stocks for intraday trading.
you should select large-cap or mid-cap stocks. The first thing to keep in mind is not small-cap stocks, but mid-cap or large-cap stocks.
1 year ago
Pending
Explicitly states that mid-cap and large-cap stocks should be prioritized over small-cap stocks for intraday trading.
you should select large-cap or mid-cap stocks. The first thing to keep in mind is not small-cap stocks, but mid-cap or large-cap stocks.
Pending
Short selling involves selling shares that are not owned, with the expectation of buying them back at a lower price later. For example, selling 100 shares at ₹100 (total ₹10,000) and then buying them back at ₹80 (total ₹8,000) results in a ₹2,000 profit.
First, you sell it. You have 100 shares of ₹100, which means you do n't have any shares. Okay, you do n't have any shares. You have a share of ₹100 in XY company. No, let's call it a share of ₹100, what did you do, you sold 100 shares of ₹100, you did not even buy it, but how did you sell it, you will ask how to sell it, I will explain further, okay ₹100 * 100, how much is it, ₹10000, okay, you sold shares of XY Jad company for ₹10000, now you thought the price would go up to 80, and the price went down to 80, now what did you do, first you sold for ₹10000, now the price came down to 80, you bought back the same number of shares as you had sold, you bought back 100 shares, 80 * 100, you bought 100 shares for 8000, now see, you sold it for 10000, bought it for 8000, so now how much profit did you make, do the math brother, there was a profit of ₹2000,
1 year ago
Pending
Short selling involves selling shares that are not owned, with the expectation of buying them back at a lower price later. For example, selling 100 shares at ₹100 (total ₹10,000) and then buying them back at ₹80 (total ₹8,000) results in a ₹2,000 profit.
First, you sell it. You have 100 shares of ₹100, which means you do n't have any shares. Okay, you do n't have any shares. You have a share of ₹100 in XY company. No, let's call it a share of ₹100, what did you do, you sold 100 shares of ₹100, you did not even buy it, but how did you sell it, you will ask how to sell it, I will explain further, okay ₹100 * 100, how much is it, ₹10000, okay, you sold shares of XY Jad company for ₹10000, now you thought the price would go up to 80, and the price went down to 80, now what did you do, first you sold for ₹10000, now the price came down to 80, you bought back the same number of shares as you had sold, you bought back 100 shares, 80 * 100, you bought 100 shares for 8000, now see, you sold it for 10000, bought it for 8000, so now how much profit did you make, do the math brother, there was a profit of ₹2000,
Pending
Short selling allows traders to profit from a decrease in an asset's price, even if the market is not moving upwards.
But if you tell me, for example, I think I can make a profit today, then yes, if the market does not go up, but if the price falls, even then a profit can be made on it. That is called short selling.
1 year ago
Pending
Short selling allows traders to profit from a decrease in an asset's price, even if the market is not moving upwards.
But if you tell me, for example, I think I can make a profit today, then yes, if the market does not go up, but if the price falls, even then a profit can be made on it. That is called short selling.
Pending
Repeats the caution against trading small-cap, penny, and small companies.
you have to avoid small cap companies, after that you have to avoid penny companies and you have to avoid small companies
1 year ago
Pending
Repeats the caution against trading small-cap, penny, and small companies.
you have to avoid small cap companies, after that you have to avoid penny companies and you have to avoid small companies
Pending
Explains market capitalization (market cap) and categorizes companies into large-cap, mid-cap, and small-cap, emphasizing the avoidance of small caps for intraday trading.
Small cap companies should be avoided. There are three types of caps. Cap means one thing, let me explain to you, that is market capitalization. ... Look, there is small cap, there is mid cap, there is large cap, which are the best companies whose market capitalization means how many shares are there and how much amount. The total amount of shares is market capitalization.
1 year ago
Pending
Explains market capitalization (market cap) and categorizes companies into large-cap, mid-cap, and small-cap, emphasizing the avoidance of small caps for intraday trading.
Small cap companies should be avoided. There are three types of caps. Cap means one thing, let me explain to you, that is market capitalization. ... Look, there is small cap, there is mid cap, there is large cap, which are the best companies whose market capitalization means how many shares are there and how much amount. The total amount of shares is market capitalization.
Pending
A common mistake in intraday trading is over-trading, where traders attempt to recover losses by making more trades within the same day, often leading to even larger losses.
there is a lot of over trading tendency, I mean what people usually do, they make a big mistake, if they incur a loss somewhere in intraday trading, then they trade more because it has to be done within a day, they think that I have lost 10 rupees today, so I should trade today itself. If you do n't have to recover, then due to over-trading, you incur even bigger losses
1 year ago
Pending
A common mistake in intraday trading is over-trading, where traders attempt to recover losses by making more trades within the same day, often leading to even larger losses.
there is a lot of over trading tendency, I mean what people usually do, they make a big mistake, if they incur a loss somewhere in intraday trading, then they trade more because it has to be done within a day, they think that I have lost 10 rupees today, so I should trade today itself. If you do n't have to recover, then due to over-trading, you incur even bigger losses
Pending
Advises trading in the direction of the prevailing trend ('be the friend of the trend') in intraday trading.
If the market is moving, then you should look for trades in the direction in which it wants to go. That means, let's say for example, if the market is moving up, then you buy. If the market is trying to move down, then sell. There is always a saying, be the friend of the trend.
1 year ago
Pending
Advises trading in the direction of the prevailing trend ('be the friend of the trend') in intraday trading.
If the market is moving, then you should look for trades in the direction in which it wants to go. That means, let's say for example, if the market is moving up, then you buy. If the market is trying to move down, then sell. There is always a saying, be the friend of the trend.
Pending
Analysis in intraday trading is time-limited to the current day, as future market movements are unpredictable, necessitating immediate study and chart pattern analysis for timely trades, which can lead to significant losses if not executed properly.
limited time analysis, you have only one day to analyze things because you cannot do today's analysis the day after tomorrow, you don't know what is going to happen two days in advance, so you will have to do today's analysis today itself, so if you want to take a trade today, you will have to do it today, you will have to study, you will have to look at the market, you will have to look at the chart patterns, you will not understand these words of technical analysis right now, let me explain it slowly, okay, after this there are rapid movements which can lead to big losses,
1 year ago
Pending
Analysis in intraday trading is time-limited to the current day, as future market movements are unpredictable, necessitating immediate study and chart pattern analysis for timely trades, which can lead to significant losses if not executed properly.
limited time analysis, you have only one day to analyze things because you cannot do today's analysis the day after tomorrow, you don't know what is going to happen two days in advance, so you will have to do today's analysis today itself, so if you want to take a trade today, you will have to do it today, you will have to study, you will have to look at the market, you will have to look at the chart patterns, you will not understand these words of technical analysis right now, let me explain it slowly, okay, after this there are rapid movements which can lead to big losses,
Pending
Reiterates the advice to avoid penny and small companies for intraday trading.
avoid penny stocks, avoid small companies
1 year ago
Pending
Reiterates the advice to avoid penny and small companies for intraday trading.
avoid penny stocks, avoid small companies
Pending
Intraday trading requires constant monitoring of the market throughout the trading day, making it time-consuming and demanding for serious participants.
it takes time and constant monitoring because the movement has to happen within a single day, so it is fast too, if you invest, for example, you buy a share, then you can leave it for a year, I will open it just once every day and see what the price is today, but here you will have to constantly observe the market throughout the day from 915 to 315 or till 3:30, so I mean not everyone does it, but if you do it carefully If you want to do it seriously, you have to give time, it means it requires time
1 year ago
Pending
Intraday trading requires constant monitoring of the market throughout the trading day, making it time-consuming and demanding for serious participants.
it takes time and constant monitoring because the movement has to happen within a single day, so it is fast too, if you invest, for example, you buy a share, then you can leave it for a year, I will open it just once every day and see what the price is today, but here you will have to constantly observe the market throughout the day from 915 to 315 or till 3:30, so I mean not everyone does it, but if you do it carefully If you want to do it seriously, you have to give time, it means it requires time
Pending
Highlights the importance of volatility (or 'wallet') in stocks for intraday trading, meaning the stock should move significantly in price within a day.
There should be a wallet. Wallet means that the market should move up or down. If it does not have a wallet, it means it will move up very slowly. If it is a ₹1 share, you can see that it is increasing by 20 paise in a day, only those are not volatile. Volatile means a share worth ₹1000000, sometimes
1 year ago
Pending
Highlights the importance of volatility (or 'wallet') in stocks for intraday trading, meaning the stock should move significantly in price within a day.
There should be a wallet. Wallet means that the market should move up or down. If it does not have a wallet, it means it will move up very slowly. If it is a ₹1 share, you can see that it is increasing by 20 paise in a day, only those are not volatile. Volatile means a share worth ₹1000000, sometimes
Pending
A disadvantage of intraday trading is the inability to hold positions for potential future gains, as all trades must be closed within the day, leading to forced selling and potential losses that could have been avoided in longer-term trading.
There is more risk in this because you have to take and sell trades within a single day. For example, you had a share worth ₹100, you think it will increase, and it increases straight to ₹150 or whatever. Now, normally, if you were doing swing trading or normal trading, You had an option that right now it is ₹150, I will hold it, tomorrow or the day after tomorrow it will come back to ₹100 and I will sell it at ₹100, you could have thought like that, but in intraday trading you don't have that option, you have to close it today itself, if you don't close it then your broker will automatically close it in the market, you will incur a loss of ₹, which you could have held in normal trading, so this is a huge loss
1 year ago
Pending
A disadvantage of intraday trading is the inability to hold positions for potential future gains, as all trades must be closed within the day, leading to forced selling and potential losses that could have been avoided in longer-term trading.
There is more risk in this because you have to take and sell trades within a single day. For example, you had a share worth ₹100, you think it will increase, and it increases straight to ₹150 or whatever. Now, normally, if you were doing swing trading or normal trading, You had an option that right now it is ₹150, I will hold it, tomorrow or the day after tomorrow it will come back to ₹100 and I will sell it at ₹100, you could have thought like that, but in intraday trading you don't have that option, you have to close it today itself, if you don't close it then your broker will automatically close it in the market, you will incur a loss of ₹, which you could have held in normal trading, so this is a huge loss
Pending
Elaborates on liquidity, emphasizing the need for sufficient demand and supply for a stock, unlike 'rubbish' or small companies.
It should be highly liquid... there should be demand and supply.
1 year ago
Pending
Elaborates on liquidity, emphasizing the need for sufficient demand and supply for a stock, unlike 'rubbish' or small companies.
It should be highly liquid... there should be demand and supply.
Pending
A 2% loss on ₹100,000 in normal trading results in ₹2,000 loss, but with 5x intraday margin, a 2% loss on the leveraged amount translates to a ₹10,000 loss.
Similarly, if it goes minus instead of plus at ₹2, if that share falls from ₹2. Now tell me what happened here, if you incur a 2% loss, it will be ₹2000, but at ₹100000 because there is a five-fold margin. A 2% loss means a loss of ₹10000.
1 year ago
Pending
A 2% loss on ₹100,000 in normal trading results in ₹2,000 loss, but with 5x intraday margin, a 2% loss on the leveraged amount translates to a ₹10,000 loss.
Similarly, if it goes minus instead of plus at ₹2, if that share falls from ₹2. Now tell me what happened here, if you incur a 2% loss, it will be ₹2000, but at ₹100000 because there is a five-fold margin. A 2% loss means a loss of ₹10000.
Pending
Strongly advises against trading small-cap and penny stocks in intraday trading due to their lack of liquidity and higher risk.
In intraday trading, small companies, penny stocks or small companies, which I just mentioned like Tanmay Girlfriend Limited, you should not trade in such companies, you should avoid such companies.
1 year ago
Pending
Strongly advises against trading small-cap and penny stocks in intraday trading due to their lack of liquidity and higher risk.
In intraday trading, small companies, penny stocks or small companies, which I just mentioned like Tanmay Girlfriend Limited, you should not trade in such companies, you should avoid such companies.
Pending
With the same capital of ₹100,000, a 2% profit in normal trading yields ₹2,000, while in intraday trading with 5x leverage, the profit can be ₹10,000.
In normal trading on 100000, if you If you want to make a profit on a 2% it will be ₹2000. In intraday trading, you will make a profit of ₹10000 right there with the same capital.
1 year ago
Pending
With the same capital of ₹100,000, a 2% profit in normal trading yields ₹2,000, while in intraday trading with 5x leverage, the profit can be ₹10,000.
In normal trading on 100000, if you If you want to make a profit on a 2% it will be ₹2000. In intraday trading, you will make a profit of ₹10000 right there with the same capital.
Pending
Suggests that top 100-200 companies are generally liquid and suitable for intraday trading.
liquid shares are those which are well-known companies, top 100 companies, top 200 companies, you can trade in all these companies.
1 year ago
Pending
Suggests that top 100-200 companies are generally liquid and suitable for intraday trading.
liquid shares are those which are well-known companies, top 100 companies, top 200 companies, you can trade in all these companies.
Pending
The 5x leverage in intraday trading is a double-edged sword: it magnifies potential profits but also magnifies potential losses if not managed properly.
This is also an advantage, it is a double edged, double edged sword, for profit there can be huge profits, for loss there can be huge losses if It is not managed properly then it is okay,
1 year ago
Pending
The 5x leverage in intraday trading is a double-edged sword: it magnifies potential profits but also magnifies potential losses if not managed properly.
This is also an advantage, it is a double edged, double edged sword, for profit there can be huge profits, for loss there can be huge losses if It is not managed properly then it is okay,
Pending
Recommends trading in large, well-known companies due to their higher liquidity and consistent demand and supply.
One should not trade in small companies. In simple words, in all the big companies, there is demand and supply, there is buying and selling.
1 year ago
Pending
Recommends trading in large, well-known companies due to their higher liquidity and consistent demand and supply.
One should not trade in small companies. In simple words, in all the big companies, there is demand and supply, there is buying and selling.
Pending
A major benefit of intraday trading is the ability to trade with five times the capital available, akin to buying ₹500,000 worth of vegetables with ₹100,000, though this must be settled by day's end.
And the even bigger benefit in this is what I just explained, that you can trade with five times the amount. For example, if there was a vegetable worth ₹1, instead of that vegetable worth ₹1, you can buy vegetables worth ₹5000000. Now, it is a different matter that by the end of the day you will have to sell that vegetable worth ₹500.
1 year ago
Pending
A major benefit of intraday trading is the ability to trade with five times the capital available, akin to buying ₹500,000 worth of vegetables with ₹100,000, though this must be settled by day's end.
And the even bigger benefit in this is what I just explained, that you can trade with five times the amount. For example, if there was a vegetable worth ₹1, instead of that vegetable worth ₹1, you can buy vegetables worth ₹5000000. Now, it is a different matter that by the end of the day you will have to sell that vegetable worth ₹500.
Pending
Intraday trading eliminates overnight risk, as all positions are closed by the end of the day, preventing potential significant capital loss due to unforeseen events occurring overnight.
And after this, there is no overnight risk in this, what does overnight risk mean, if you have actually done swing trading or have bought any shares, what happens, many times things are going well, going well and at night something goes wrong, something happens, okay, something happens and the next day you wake up in the morning and what has happened, your capital of ₹1 lakh has become ₹20,000.
1 year ago
Pending
Intraday trading eliminates overnight risk, as all positions are closed by the end of the day, preventing potential significant capital loss due to unforeseen events occurring overnight.
And after this, there is no overnight risk in this, what does overnight risk mean, if you have actually done swing trading or have bought any shares, what happens, many times things are going well, going well and at night something goes wrong, something happens, okay, something happens and the next day you wake up in the morning and what has happened, your capital of ₹1 lakh has become ₹20,000.
Pending
A key criterion for selecting stocks for intraday trading is high liquidity, meaning active buying and selling.
It should be highly liquid.
1 year ago
Pending
A key criterion for selecting stocks for intraday trading is high liquidity, meaning active buying and selling.
It should be highly liquid.
Pending
A key advantage of intraday trading is the potential for quick profits or losses, realized within the same day.
The pros are that in this you get to see quick profit. Quick profit means you will get profit or loss within a single day.
1 year ago
Pending
A key advantage of intraday trading is the potential for quick profits or losses, realized within the same day.
The pros are that in this you get to see quick profit. Quick profit means you will get profit or loss within a single day.
Pending
Identifies a major risk of short selling: unlimited potential losses if the asset's price rises instead of falls.
one of the biggest disadvantages of short selling is that if the price goes against your expectations, you thought it would fall but if it increases then you can suffer a huge loss
1 year ago
Pending
Identifies a major risk of short selling: unlimited potential losses if the asset's price rises instead of falls.
one of the biggest disadvantages of short selling is that if the price goes against your expectations, you thought it would fall but if it increases then you can suffer a huge loss
Pending
In intraday trading, traders do not receive actual ownership of shares, they are held only for the day. This leverage allows for potential profits if the price increases, which is highlighted as a significant advantage.
They do n't give it at all, understand that for example, Reliance gives you shares on credit for 1 day, thinking that if you don't return it anyway, they will sell it and take it back from you, so you are not getting the actual ownership of the shares, the shares are just in your hands for one day, hence the shares worth 1000 are given to you for ₹200 only for one day, so that if it increases from 200 to 220, 205, 210, then you will make a profit and exit from it, this is intraday trading and it is very important to understand that this is the biggest advantage of intraday trading
1 year ago
Pending
In intraday trading, traders do not receive actual ownership of shares, they are held only for the day. This leverage allows for potential profits if the price increases, which is highlighted as a significant advantage.
They do n't give it at all, understand that for example, Reliance gives you shares on credit for 1 day, thinking that if you don't return it anyway, they will sell it and take it back from you, so you are not getting the actual ownership of the shares, the shares are just in your hands for one day, hence the shares worth 1000 are given to you for ₹200 only for one day, so that if it increases from 200 to 220, 205, 210, then you will make a profit and exit from it, this is intraday trading and it is very important to understand that this is the biggest advantage of intraday trading
Pending
Explains the core mechanism of short selling: selling an asset before buying it back.
In short selling, you sell first and then buy it later.
1 year ago
Pending
Explains the core mechanism of short selling: selling an asset before buying it back.
In short selling, you sell first and then buy it later.
Pending
Defines short selling as a strategy to profit from a decrease in an asset's price.
if the price falls, even then a profit can be made on it. That is called short selling.
1 year ago
Pending
Defines short selling as a strategy to profit from a decrease in an asset's price.
if the price falls, even then a profit can be made on it. That is called short selling.
Pending
Intraday trading offers 5x leverage, allowing traders to buy shares worth ₹1000 for approximately ₹200, effectively providing five times the buying power.
In this, you get shares at five times cheaper rates. What does this mean? If, for example, the price of a share is ₹ 1000, you want to buy that share. Normally, you would get that share for ₹1000, but in intraday trading, you are able to buy it for around ₹200. Now you will say that if the share is worth ₹1000, then why is it available for ₹200? See what happens. In intraday trading, there is something called leverage, which means you get five times the power to buy.
1 year ago
Pending
Intraday trading offers 5x leverage, allowing traders to buy shares worth ₹1000 for approximately ₹200, effectively providing five times the buying power.
In this, you get shares at five times cheaper rates. What does this mean? If, for example, the price of a share is ₹ 1000, you want to buy that share. Normally, you would get that share for ₹1000, but in intraday trading, you are able to buy it for around ₹200. Now you will say that if the share is worth ₹1000, then why is it available for ₹200? See what happens. In intraday trading, there is something called leverage, which means you get five times the power to buy.
Pending
Discusses the tendency for overtrading in intraday trading, where traders might try to recover losses quickly by taking more trades within the same day.
if you incur a loss somewhere in intraday trading, then they trade more because it has to be done within a day, they think that I have lost 10 rupees today, so I should trade today itself.
1 year ago
Pending
Discusses the tendency for overtrading in intraday trading, where traders might try to recover losses quickly by taking more trades within the same day.
if you incur a loss somewhere in intraday trading, then they trade more because it has to be done within a day, they think that I have lost 10 rupees today, so I should trade today itself.
Pending
Explains that in intraday trading, any open positions are automatically closed at the end of the trading day, regardless of profit or loss.
For example, if you buy a share of a company called XYZ and you don't sell it by the end of the day, it will automatically be sold. For example, if you bought a share worth ₹1, and you thought its price would go up to ₹120, and instead of increasing, its price decreased. Even if you don't sell it, no matter how much your loss is, it will automatically close at the end of the day.
1 year ago
Pending
Explains that in intraday trading, any open positions are automatically closed at the end of the trading day, regardless of profit or loss.
For example, if you buy a share of a company called XYZ and you don't sell it by the end of the day, it will automatically be sold. For example, if you bought a share worth ₹1, and you thought its price would go up to ₹120, and instead of increasing, its price decreased. Even if you don't sell it, no matter how much your loss is, it will automatically close at the end of the day.
Pending
A disadvantage of intraday trading is the increased risk due to the requirement of closing all positions within the same day.
There is more risk in this because you have to take and sell trades within a single day.
1 year ago
Pending
A disadvantage of intraday trading is the increased risk due to the requirement of closing all positions within the same day.
There is more risk in this because you have to take and sell trades within a single day.
Pending
Defines intraday trading as the process of buying and selling assets within the same trading day.
Buying and selling within a single day is called intraday trading. Buying and selling within a single day.
1 year ago
Pending
Defines intraday trading as the process of buying and selling assets within the same trading day.
Buying and selling within a single day is called intraday trading. Buying and selling within a single day.
Pending
Highlights that the 5x leverage in intraday trading amplifies both potential profits and losses.
The profits are big, the losses are also big. Okay, now we move on to the next topic. Wait a second. Next, about the disadvantages of e-cons.
1 year ago
Pending
Highlights that the 5x leverage in intraday trading amplifies both potential profits and losses.
The profits are big, the losses are also big. Okay, now we move on to the next topic. Wait a second. Next, about the disadvantages of e-cons.
Pending
The speaker announces upcoming free courses on Price Action Trading and Smart Money Concept Trading.
Along with this, the next course which is going to come is Price Action Trading Course, then Smart Money Concept Trading Course, everything related to trading. Related: I will teach you completely free of cost.
1 year ago
Pending
The speaker announces upcoming free courses on Price Action Trading and Smart Money Concept Trading.
Along with this, the next course which is going to come is Price Action Trading Course, then Smart Money Concept Trading Course, everything related to trading. Related: I will teach you completely free of cost.
Pending
Illustrates the power of leverage in intraday trading, where a small amount can be used to control a much larger value of assets.
For example, if there was a vegetable worth ₹1, instead of that vegetable worth ₹1, you can buy vegetables worth ₹5000000.
1 year ago
Pending
Illustrates the power of leverage in intraday trading, where a small amount can be used to control a much larger value of assets.
For example, if there was a vegetable worth ₹1, instead of that vegetable worth ₹1, you can buy vegetables worth ₹5000000.
Pending
The speaker promises to finish the entire intraday trading course within two weeks if the video achieves 10,000 likes.
If this video gets 10,000 likes, then I will complete this entire course within two weeks.
1 year ago
Pending
The speaker promises to finish the entire intraday trading course within two weeks if the video achieves 10,000 likes.
If this video gets 10,000 likes, then I will complete this entire course within two weeks.
Pending
Reiterates the significant benefit of intraday trading: the ability to trade with five times the capital due to leverage.
the even bigger benefit in this is what I just explained, that you can trade with five times the amount.
1 year ago
Pending
Reiterates the significant benefit of intraday trading: the ability to trade with five times the capital due to leverage.
the even bigger benefit in this is what I just explained, that you can trade with five times the amount.
Pending
The speaker reiterates that 10,000 likes on the video will lead to the completion of the course, encouraging engagement with the option of negative feedback.
If you get 10,000 likes on this video, then if you do n't like it, then abuse me in the comments. You are completely open to whatever you want to do.
1 year ago
Pending
The speaker reiterates that 10,000 likes on the video will lead to the completion of the course, encouraging engagement with the option of negative feedback.
If you get 10,000 likes on this video, then if you do n't like it, then abuse me in the comments. You are completely open to whatever you want to do.
Pending
Intraday trading eliminates overnight risk, as all positions are closed by the end of the trading day.
after this there is no overnight risk in this
1 year ago
Pending
Intraday trading eliminates overnight risk, as all positions are closed by the end of the trading day.
after this there is no overnight risk in this
Pending
The speaker pledges to finish the current intraday trading course in two weeks if the video gets 10,000 likes, and also announces plans to offer free Price Action and Smart Money Concept trading courses.
If this video gets 10,000 likes, then I will complete this entire course within two weeks. Along with this, the next course which is going to come is Price Action Trading Course, then Smart Money Concept Trading Course, everything related to trading. Related: I will teach you completely free of cost.
1 year ago
Pending
The speaker pledges to finish the current intraday trading course in two weeks if the video gets 10,000 likes, and also announces plans to offer free Price Action and Smart Money Concept trading courses.
If this video gets 10,000 likes, then I will complete this entire course within two weeks. Along with this, the next course which is going to come is Price Action Trading Course, then Smart Money Concept Trading Course, everything related to trading. Related: I will teach you completely free of cost.
Pending
A key advantage of intraday trading is the potential for quick profits, realized within the same day.
The pros are that in this you get to see quick profit.
1 year ago
Pending
A key advantage of intraday trading is the potential for quick profits, realized within the same day.
The pros are that in this you get to see quick profit.
Pending
Analogy explaining intraday trading leverage: ₹100 capital allows trading ₹500 worth of goods, which must be sold within the same day.
He will give you vegetables worth Rs. 500 for Rs. 100, understood? And you have to sell those vegetables worth Rs. 500 within a single day.
1 year ago
Pending
Analogy explaining intraday trading leverage: ₹100 capital allows trading ₹500 worth of goods, which must be sold within the same day.
He will give you vegetables worth Rs. 500 for Rs. 100, understood? And you have to sell those vegetables worth Rs. 500 within a single day.
Pending
Illustrates the concept of leverage in intraday trading, where ₹10 capital can be used to trade ₹50 worth of shares due to the 5x leverage.
if you have ₹10000, how much amount of shares can you buy with ₹10000, if you have ₹100, don't get confused like this, if you have 10, then you can buy shares worth ₹50 only
1 year ago
Pending
Illustrates the concept of leverage in intraday trading, where ₹10 capital can be used to trade ₹50 worth of shares due to the 5x leverage.
if you have ₹10000, how much amount of shares can you buy with ₹10000, if you have ₹100, don't get confused like this, if you have 10, then you can buy shares worth ₹50 only
Pending
The speaker promises to complete the entire intraday trading course within two weeks if the video reaches 10,000 likes.
If this video gets 10,000 likes, then I will complete this entire course within two weeks.
1 year ago
Pending
The speaker promises to complete the entire intraday trading course within two weeks if the video reaches 10,000 likes.
If this video gets 10,000 likes, then I will complete this entire course within two weeks.
Pending
Intraday trading offers a 5x leverage, allowing traders to control five times the value of their capital.
In this, you get shares at five times cheaper rates.
1 year ago
Pending
Intraday trading offers a 5x leverage, allowing traders to control five times the value of their capital.
In this, you get shares at five times cheaper rates.
Pending
Definition of intraday trading as buying and selling within the same trading day.
Buying and selling within a single day is called intraday trading.
1 year ago
Pending
Definition of intraday trading as buying and selling within the same trading day.
Buying and selling within a single day is called intraday trading.
Pending
The speaker plans to release the entire intraday trading course within two weeks if the video reaches 10,000 likes.
If this video gets 10,000 likes, then I will complete this entire course within two weeks.
1 year ago
Pending
The speaker plans to release the entire intraday trading course within two weeks if the video reaches 10,000 likes.
If this video gets 10,000 likes, then I will complete this entire course within two weeks.
Pending
The next video will cover how complete beginners can start trading in the market.
And if you are a complete beginner who has just started reading about the markets then the next video is going to be on how you can start trading in the market, so please stay tuned, you will probably find its link in the description as well if it is already uploaded.
1 year ago
Pending
The next video will cover how complete beginners can start trading in the market.
And if you are a complete beginner who has just started reading about the markets then the next video is going to be on how you can start trading in the market, so please stay tuned, you will probably find its link in the description as well if it is already uploaded.
Pending
The speaker offers free courses on chart pattern trading, price action trading, options trading, and intraday trading.
If you want a full chart pattern trading course, if you want a price action trading course, if you want an options trading course, if you want an intraday trading course, I provide all the courses completely free of cost.
1 year ago
Pending
The speaker offers free courses on chart pattern trading, price action trading, options trading, and intraday trading.
If you want a full chart pattern trading course, if you want a price action trading course, if you want an options trading course, if you want an intraday trading course, I provide all the courses completely free of cost.
Pending
Using a line chart makes chart pattern identification, such as the W pattern, much easier compared to using 15-minute candlestick charts.
If you were to look at this same pattern on 15-minute candles, you wouldn't have understood it as easily. Look, this W pattern here, are you able to understand it easily? Even here, the W pattern isn't easily understood, and the difficulty in seeing it goes away. Similarly, if you use a line chart, it becomes a very simple method. With this, no matter what the chart pattern is, everything works out well.
1 year ago
Pending
Using a line chart makes chart pattern identification, such as the W pattern, much easier compared to using 15-minute candlestick charts.
If you were to look at this same pattern on 15-minute candles, you wouldn't have understood it as easily. Look, this W pattern here, are you able to understand it easily? Even here, the W pattern isn't easily understood, and the difficulty in seeing it goes away. Similarly, if you use a line chart, it becomes a very simple method. With this, no matter what the chart pattern is, everything works out well.
Pending
The W pattern, also known as a double bottom pattern, indicates that the market is going to run up after its appearance.
So, whatever points you have to find out, like this, you will see W pattern, M pattern, all these things can be easily identified in the market, so what is in the W pattern, we also call the W pattern a double bottom pattern, okay, what does the double bottom pattern tell us, if you see a double bottom pattern or a W pattern, then what is going to happen in the market, this is question number two, what happens in the market when a W pattern appears, one to the comment down below, see what happens in the W pattern, the market first comes down in a down trend and as soon as the W pattern is found, the market runs up, as you can see, even after this the market has run upwards in this way
1 year ago
Pending
The W pattern, also known as a double bottom pattern, indicates that the market is going to run up after its appearance.
So, whatever points you have to find out, like this, you will see W pattern, M pattern, all these things can be easily identified in the market, so what is in the W pattern, we also call the W pattern a double bottom pattern, okay, what does the double bottom pattern tell us, if you see a double bottom pattern or a W pattern, then what is going to happen in the market, this is question number two, what happens in the market when a W pattern appears, one to the comment down below, see what happens in the W pattern, the market first comes down in a down trend and as soon as the W pattern is found, the market runs up, as you can see, even after this the market has run upwards in this way
Pending
When a W pattern is identified, the market is predicted to run up after a previous downtrend.
What happens in the W pattern, the market first comes down in a down trend and as soon as the W pattern is found, the market runs up, as you can see, even after this the market has run upwards in this way
1 year ago
Pending
When a W pattern is identified, the market is predicted to run up after a previous downtrend.
What happens in the W pattern, the market first comes down in a down trend and as soon as the W pattern is found, the market runs up, as you can see, even after this the market has run upwards in this way
Pending
Chart patterns like W and M patterns can be easily identified in the market using the line chart method for drawing trend lines.
And I have given their links in the description, so in this way you can identify all the points, if you were on a candlestick chart, then many times it is becoming difficult, see here it is becoming difficult to see, what will happen to some people when If they go to draw a trend line from here, then if some people's trend line starts from here, then for some people it may start from here, some people may consider it, some people may consider it, then what will happen after that, some such trend line will go, some such trend line will go along with it, due to a slight difference in the point of some people, this much trend line will go, now see, your analysis will completely change according to all three trend lines a, b and c, because of this the best and just way, especially for beginners, what they have to do is simply go to the line chart instead of candlestick, and many professional traders use this method, although if you become professional enough, then you do not need to draw lines, it automatically comes to your mind, but now look here, if you see, it has become so easy, you just have to connect this, this, this, this way, okay, so what will you do, yours will be connected directly like this, in this way you will be able to avoid fake points and your trend line will be absolutely perfect, see, now look here again, if we draw a straight line If you do it this way, it will come in the same way, you have to join the points below, so you will directly catch the points below and you can match the points which match you, like this one became one, then this one with that, in this way you can create your trend lines in the best way and see, here you will also see a pattern, whatever points you have to find out, like this, you will see W pattern, M pattern, all these things can be easily identified in the market
1 year ago
Pending
Chart patterns like W and M patterns can be easily identified in the market using the line chart method for drawing trend lines.
And I have given their links in the description, so in this way you can identify all the points, if you were on a candlestick chart, then many times it is becoming difficult, see here it is becoming difficult to see, what will happen to some people when If they go to draw a trend line from here, then if some people's trend line starts from here, then for some people it may start from here, some people may consider it, some people may consider it, then what will happen after that, some such trend line will go, some such trend line will go along with it, due to a slight difference in the point of some people, this much trend line will go, now see, your analysis will completely change according to all three trend lines a, b and c, because of this the best and just way, especially for beginners, what they have to do is simply go to the line chart instead of candlestick, and many professional traders use this method, although if you become professional enough, then you do not need to draw lines, it automatically comes to your mind, but now look here, if you see, it has become so easy, you just have to connect this, this, this, this way, okay, so what will you do, yours will be connected directly like this, in this way you will be able to avoid fake points and your trend line will be absolutely perfect, see, now look here again, if we draw a straight line If you do it this way, it will come in the same way, you have to join the points below, so you will directly catch the points below and you can match the points which match you, like this one became one, then this one with that, in this way you can create your trend lines in the best way and see, here you will also see a pattern, whatever points you have to find out, like this, you will see W pattern, M pattern, all these things can be easily identified in the market
Pending
The next video will cover how to start trading in the market.
The next video is going to be on how you can start trading in the market, so please stay tuned, you will probably find its link in the description as well if it is already uploaded.
1 year ago
Pending
The next video will cover how to start trading in the market.
The next video is going to be on how you can start trading in the market, so please stay tuned, you will probably find its link in the description as well if it is already uploaded.
Pending
For beginners, drawing trend lines and support/resistance using the line chart method is the best way to avoid differences in analysis and potential missed profits.
for beginners, this is the best way to draw support and resistance lines, trend lines, because they and my In analysis, there may be a difference of 10-10, 20-20 points while drawing trend lines between your analysis and mine and because of that you may miss out on a good profit.
1 year ago
Pending
For beginners, drawing trend lines and support/resistance using the line chart method is the best way to avoid differences in analysis and potential missed profits.
for beginners, this is the best way to draw support and resistance lines, trend lines, because they and my In analysis, there may be a difference of 10-10, 20-20 points while drawing trend lines between your analysis and mine and because of that you may miss out on a good profit.
Pending
A W pattern (double bottom) signals that the market will run up after coming down in a downtrend.
if you see a double bottom pattern or a W pattern, then what is going to happen in the market, this is question number two, what happens in the market when a W pattern appears, one to the comment down below, see what happens in the W pattern, the market first comes down in a down trend and as soon as the W pattern is found, the market runs up, as you can see, even after this the market has run upwards in this way
1 year ago
Pending
A W pattern (double bottom) signals that the market will run up after coming down in a downtrend.
if you see a double bottom pattern or a W pattern, then what is going to happen in the market, this is question number two, what happens in the market when a W pattern appears, one to the comment down below, see what happens in the W pattern, the market first comes down in a down trend and as soon as the W pattern is found, the market runs up, as you can see, even after this the market has run upwards in this way
Pending
A Put Call Ratio (PCR) below 1 (specifically 0.88 in an example) suggests a bearish market outlook. A PCR below 0.7 indicates an oversold condition and potential for a market reversal upwards.
So if it is below 1, which is 0.88, what does it mean? ... 0.88 means it is below 1, which means the market can remain bearish. ... And if the PCR is below 0.7, it means that the market has fallen too much and become too bearish Then it is possible that the market will come back up
1 year ago
Pending
A Put Call Ratio (PCR) below 1 (specifically 0.88 in an example) suggests a bearish market outlook. A PCR below 0.7 indicates an oversold condition and potential for a market reversal upwards.
So if it is below 1, which is 0.88, what does it mean? ... 0.88 means it is below 1, which means the market can remain bearish. ... And if the PCR is below 0.7, it means that the market has fallen too much and become too bearish Then it is possible that the market will come back up
Pending
An option seller's prediction is that the market will not exceed a specific level (e.g., ₹150).
the option seller feels that it can't go above ₹150.
1 year ago
Pending
An option seller's prediction is that the market will not exceed a specific level (e.g., ₹150).
the option seller feels that it can't go above ₹150.
Pending
Analysis of Open Interest indicates potential resistance at 52,500 and strong support around 50,000 and 46,000 for Reliance.
And 50,000 option sellers think that the market has to be below this. So 52,500 is your potential resistance. ... 46,000. Here you can see the quantity of open interest. At a strike price of 51,000. ... 50,000 option seller is the one, and the analysis of 46,000 option seller is correct. ... These people, and those who don't know about it, they make a lot of mistakes and trade against the options seller.
1 year ago
Pending
Analysis of Open Interest indicates potential resistance at 52,500 and strong support around 50,000 and 46,000 for Reliance.
And 50,000 option sellers think that the market has to be below this. So 52,500 is your potential resistance. ... 46,000. Here you can see the quantity of open interest. At a strike price of 51,000. ... 50,000 option seller is the one, and the analysis of 46,000 option seller is correct. ... These people, and those who don't know about it, they make a lot of mistakes and trade against the options seller.
Pending
A method to start option selling with significantly less capital (50-70% reduction) will be taught in the next lecture.
in the next lecture, I'm going to tell you a method by which you can start option selling with very little money. Although it wo n't be as low as buying options, but it can be more than 50, 60, or 70 percent. You can sell options by reducing your price.
1 year ago
Pending
A method to start option selling with significantly less capital (50-70% reduction) will be taught in the next lecture.
in the next lecture, I'm going to tell you a method by which you can start option selling with very little money. Although it wo n't be as low as buying options, but it can be more than 50, 60, or 70 percent. You can sell options by reducing your price.
Pending
A strong support level for Nifty is indicated where there is a high open interest on the put side, suggesting option sellers believe the market will stay above that level.
This means that this can become a strong support level for us. Because most of the option sellers think that the market will take support from this or will stay above this. If there is more open interest in the put side, the market will go above that.
1 year ago
Pending
A strong support level for Nifty is indicated where there is a high open interest on the put side, suggesting option sellers believe the market will stay above that level.
This means that this can become a strong support level for us. Because most of the option sellers think that the market will take support from this or will stay above this. If there is more open interest in the put side, the market will go above that.
Pending
A significant open interest on the call side suggests the market will fall, while a significant open interest on the put side suggests the market will rise. The change in OI can indicate increased confidence from option sellers.
And if on the call side, which is the call from the perspective of the option seller, then whenever it is more there, it means the market will fall down from there. I hope you understood. It wouldn't have been too complicated. Now, the change in OI can be either plus or minus. Plus means the number of orders has increased. Sorry, the question is, when can contracts and option sellers sign when they are sure of their decision or when they gain more confidence. So whenever there is a new number at a specific strike price, for example, 37, 800, the number will increase by 20, 000.
1 year ago
Pending
A significant open interest on the call side suggests the market will fall, while a significant open interest on the put side suggests the market will rise. The change in OI can indicate increased confidence from option sellers.
And if on the call side, which is the call from the perspective of the option seller, then whenever it is more there, it means the market will fall down from there. I hope you understood. It wouldn't have been too complicated. Now, the change in OI can be either plus or minus. Plus means the number of orders has increased. Sorry, the question is, when can contracts and option sellers sign when they are sure of their decision or when they gain more confidence. So whenever there is a new number at a specific strike price, for example, 37, 800, the number will increase by 20, 000.
Pending
Options trading can be used effectively for hedging equities, with put options costing a small premium (e.g., ₹10) and potentially saving significant losses if the stock price falls.
you can use options trading in a very profitable and economical way in your trading career or trading journey. If you trade only equities, suppose you have hdfc0005010, then at most, the premium you have paid to purchase the put option will be ₹10. But if your analysis is correct and that price actually falls, then you can save yourself a huge loss
1 year ago
Pending
Options trading can be used effectively for hedging equities, with put options costing a small premium (e.g., ₹10) and potentially saving significant losses if the stock price falls.
you can use options trading in a very profitable and economical way in your trading career or trading journey. If you trade only equities, suppose you have hdfc0005010, then at most, the premium you have paid to purchase the put option will be ₹10. But if your analysis is correct and that price actually falls, then you can save yourself a huge loss
Pending
Analysis of Open Interest suggests potential resistance at 25,200 and strong support at 24,700 and 24,800, based on the beliefs of option sellers.
This means that 38,000 option sellers think that the market will stay lower than this, it means it could be right. ... 47,000 option sellers believe that the market will stay above 24,800 or above 24,800. ... 33,800 put option. The seller thinks that the market will stay above 24,700. This is a support level of 24,700. ... 33,000. This means that this can become a strong support level for us.
1 year ago
Pending
Analysis of Open Interest suggests potential resistance at 25,200 and strong support at 24,700 and 24,800, based on the beliefs of option sellers.
This means that 38,000 option sellers think that the market will stay lower than this, it means it could be right. ... 47,000 option sellers believe that the market will stay above 24,800 or above 24,800. ... 33,800 put option. The seller thinks that the market will stay above 24,700. This is a support level of 24,700. ... 33,000. This means that this can become a strong support level for us.
Pending
Option sellers, often institutions with teams and data, have a higher probability of becoming profitable due to their analytical capabilities.
Because it's believed that option sellers have a team ... they have data on the market ... the chances of an option seller becoming profitable are higher
1 year ago
Pending
Option sellers, often institutions with teams and data, have a higher probability of becoming profitable due to their analytical capabilities.
Because it's believed that option sellers have a team ... they have data on the market ... the chances of an option seller becoming profitable are higher
Pending
26,000 is identified as a potential resistance level for Nifty, based on a large number of option sellers believing the market will not move above this price.
They believe that 26, 000, which is the imaginary line, Banalo. Are we 25,000 RU or 26,000 rupe? Open interest, open contracts, option seller Option option. The option buyer has to tell what is going to happen in the market. The option buyer has to tell that the market will go up by Rs. 25, 000. The more it goes up, the more profit it will get. But the option seller will say that the market does not have to go above Rs. 26, 000.
1 year ago
Pending
26,000 is identified as a potential resistance level for Nifty, based on a large number of option sellers believing the market will not move above this price.
They believe that 26, 000, which is the imaginary line, Banalo. Are we 25,000 RU or 26,000 rupe? Open interest, open contracts, option seller Option option. The option buyer has to tell what is going to happen in the market. The option buyer has to tell that the market will go up by Rs. 25, 000. The more it goes up, the more profit it will get. But the option seller will say that the market does not have to go above Rs. 26, 000.
Pending
Option sellers profit by predicting that the market will not go beyond a certain level, rather than predicting exact price movements.
option seller does n't have to be told what's going to happen in the market; instead, they have to be told what can't happen in the market. ... the option seller feels that it can't go above ₹150.
1 year ago
Pending
Option sellers profit by predicting that the market will not go beyond a certain level, rather than predicting exact price movements.
option seller does n't have to be told what's going to happen in the market; instead, they have to be told what can't happen in the market. ... the option seller feels that it can't go above ₹150.
Pending
Reliance Industries has a potential key resistance level at 52,500, with a large number of option sellers expecting the market to stay below this price.
And 50, 000 option sellers think that the market has to be below this. So 52, 500 is your potential resistance. It becomes an important key resistance level.
1 year ago
Pending
Reliance Industries has a potential key resistance level at 52,500, with a large number of option sellers expecting the market to stay below this price.
And 50, 000 option sellers think that the market has to be below this. So 52, 500 is your potential resistance. It becomes an important key resistance level.
Pending
There is a significant difference in capital required for option buying (around ₹5,000,000) versus option selling (around ₹87 for the same call option).
in option buying it is costing ₹ 5000000, something close to that and for selling the same call option, it is costing you ₹ 87
1 year ago
Pending
There is a significant difference in capital required for option buying (around ₹5,000,000) versus option selling (around ₹87 for the same call option).
in option buying it is costing ₹ 5000000, something close to that and for selling the same call option, it is costing you ₹ 87
Pending
Reliance Industries has potential strong support levels at 50,500 and 46,000, with a significant number of option sellers betting on the market staying above these levels.
The market will be above 500. This will be a very strong support area. Along with that, there will be another strong support area. That is 46,000. Here you can see the quantity of open interest. At a strike price of 51, 000. Where you can see a little bit in the opposite. 17, 000. But that is not very big compared to 46, 000. So 46, 000 options are for the seller. The market will be above this.
1 year ago
Pending
Reliance Industries has potential strong support levels at 50,500 and 46,000, with a significant number of option sellers betting on the market staying above these levels.
The market will be above 500. This will be a very strong support area. Along with that, there will be another strong support area. That is 46,000. Here you can see the quantity of open interest. At a strike price of 51, 000. Where you can see a little bit in the opposite. 17, 000. But that is not very big compared to 46, 000. So 46, 000 options are for the seller. The market will be above this.
Pending
Selling one lot of options costs around ₹140,000, significantly more than buying options.
for selling one lot of option, it is costing you ₹ 2380, that is, what was being done there for ₹ 800 or ₹ 6000, here it is costing ₹ 140000
1 year ago
Pending
Selling one lot of options costs around ₹140,000, significantly more than buying options.
for selling one lot of option, it is costing you ₹ 2380, that is, what was being done there for ₹ 800 or ₹ 6000, here it is costing ₹ 140000
Pending
A PCR ratio below 0.7 indicates an overly bearish market, suggesting a potential for the market to reverse and move upwards.
And if the PCR is below 0.7, it means that the market has fallen too much and become too bearish. Then it is possible that the market will come back up.
1 year ago
Pending
A PCR ratio below 0.7 indicates an overly bearish market, suggesting a potential for the market to reverse and move upwards.
And if the PCR is below 0.7, it means that the market has fallen too much and become too bearish. Then it is possible that the market will come back up.
Pending
A PCR ratio above 1.3 indicates an overly bullish market, suggesting a potential for reversal and a move downwards to a more normal level.
If the PCR ratio is above 1.3, it means that the market has become too bullish. When the market is too bullish, it is not necessary that it will come down but when it is too bullish, there are chances that the market will take a reversal and come down to a normal level.
1 year ago
Pending
A PCR ratio above 1.3 indicates an overly bullish market, suggesting a potential for reversal and a move downwards to a more normal level.
If the PCR ratio is above 1.3, it means that the market has become too bullish. When the market is too bullish, it is not necessary that it will come down but when it is too bullish, there are chances that the market will take a reversal and come down to a normal level.
Pending
Combining both option buying and selling to create a personalized trading strategy is recommended.
I suggest is combining both buying and selling options. By combining them to create your own trading strategy, creating a proper plan and framework.
1 year ago
Pending
Combining both option buying and selling to create a personalized trading strategy is recommended.
I suggest is combining both buying and selling options. By combining them to create your own trading strategy, creating a proper plan and framework.
Pending
A future lecture will cover a method to start option selling with significantly reduced capital, potentially 30-50% of the usual requirement.
In the next lecture, I'm going to tell you a method by which you can start option selling with very little money. Although it wo n't be as low as buying options, but it can be more than 50, 60, or 70 percent.
1 year ago
Pending
A future lecture will cover a method to start option selling with significantly reduced capital, potentially 30-50% of the usual requirement.
In the next lecture, I'm going to tell you a method by which you can start option selling with very little money. Although it wo n't be as low as buying options, but it can be more than 50, 60, or 70 percent.
Pending
Option selling requires at least ₹1 lakh in capital.
option selling requires a lot of capital, a minimum of ₹1 lakh.
1 year ago
Pending
Option selling requires at least ₹1 lakh in capital.
option selling requires a lot of capital, a minimum of ₹1 lakh.
Pending
Option sellers focus on predicting market limits, while option buyers must predict exact price movements.
what the option seller has to be told is that even if the market goes up or down, it won't go above this level. But the option buyer has to be told exactly where and how much the market will rise or fall.
1 year ago
Pending
Option sellers focus on predicting market limits, while option buyers must predict exact price movements.
what the option seller has to be told is that even if the market goes up or down, it won't go above this level. But the option buyer has to be told exactly where and how much the market will rise or fall.
Pending
Option sellers don't need to predict market direction, but rather where it won't go.
as an option seller you do not have to predict where the market will go. You just have to predict where the market will go.
1 year ago
Pending
Option sellers don't need to predict market direction, but rather where it won't go.
as an option seller you do not have to predict where the market will go. You just have to predict where the market will go.
Pending
The success rate for options buyers is 33%, while for option sellers it's 67%.
in the stock market the probability of an options buyer being successful is 33 and the probability percentage of an option seller being successful is 67
1 year ago
Pending
The success rate for options buyers is 33%, while for option sellers it's 67%.
in the stock market the probability of an options buyer being successful is 33 and the probability percentage of an option seller being successful is 67
Pending
Option buying can be done with small capital, while option selling requires substantial capital.
you can buy option even with a very small amount in option buying, for option selling you need a huge capital without It's not possible for large capital.
1 year ago
Pending
Option buying can be done with small capital, while option selling requires substantial capital.
you can buy option even with a very small amount in option buying, for option selling you need a huge capital without It's not possible for large capital.
Pending
Option selling requires a minimum capital of ₹1 lakh.
For option selling, you need a minimum capital of ₹1 lakh.
1 year ago
Pending
Option selling requires a minimum capital of ₹1 lakh.
For option selling, you need a minimum capital of ₹1 lakh.
Pending
AI will continue to evolve and integrate into our lives, presenting both opportunities and challenges.
I think we'll see AI continue to evolve and become more integrated into our lives, creating both opportunities and challenges.
1 year ago
Pending
AI will continue to evolve and integrate into our lives, presenting both opportunities and challenges.
I think we'll see AI continue to evolve and become more integrated into our lives, creating both opportunities and challenges.
Pending
Robots will undertake more complex tasks in manufacturing, logistics, and healthcare.
And robots performing more complex tasks in manufacturing, logistics, and even healthcare.
1 year ago
Pending
Robots will undertake more complex tasks in manufacturing, logistics, and healthcare.
And robots performing more complex tasks in manufacturing, logistics, and even healthcare.
Pending
Self-driving cars are predicted to become more widespread and efficient.
We could see self-driving cars become more widespread and efficient.
1 year ago
Pending
Self-driving cars are predicted to become more widespread and efficient.
We could see self-driving cars become more widespread and efficient.
Pending
Advanced AI models will drive breakthroughs in robotics and autonomous systems.
I think the development of more advanced AI models will lead to breakthroughs in areas like robotics and autonomous systems.
1 year ago
Pending
Advanced AI models will drive breakthroughs in robotics and autonomous systems.
I think the development of more advanced AI models will lead to breakthroughs in areas like robotics and autonomous systems.
Pending
AI will enhance content discovery and curation based on individual preferences.
And AI will help us discover and curate content tailored to our individual preferences.
1 year ago
Pending
AI will enhance content discovery and curation based on individual preferences.
And AI will help us discover and curate content tailored to our individual preferences.
Pending
AI-generated music, art, and films are expected to become commonplace.
AI-generated music, art, and even entire films could become commonplace.
1 year ago
Pending
AI-generated music, art, and films are expected to become commonplace.
AI-generated music, art, and even entire films could become commonplace.
Pending
AI will become integral to media creation and consumption.
I think we're going to see AI become a crucial part of how we create and consume media.
1 year ago
Pending
AI will become integral to media creation and consumption.
I think we're going to see AI become a crucial part of how we create and consume media.
Pending
AI tutors will offer immediate feedback and support to students.
And AI tutors will provide instant feedback and support.
1 year ago
Pending
AI tutors will offer immediate feedback and support to students.
And AI tutors will provide instant feedback and support.
Pending
AI-powered personalized learning platforms will adapt to individual student needs and styles.
Personalized learning platforms powered by AI will adapt to each student's needs and learning style.
1 year ago
Pending
AI-powered personalized learning platforms will adapt to individual student needs and styles.
Personalized learning platforms powered by AI will adapt to each student's needs and learning style.
Pending
AI will play a significant role in the future of education.
I think we're also going to see AI play a significant role in education.
1 year ago
Pending
AI will play a significant role in the future of education.
I think we're also going to see AI play a significant role in education.
Pending
AI will aid in developing effective climate change mitigation strategies.
And help us develop more effective strategies for mitigating the effects of climate change.
1 year ago
Pending
AI will aid in developing effective climate change mitigation strategies.
And help us develop more effective strategies for mitigating the effects of climate change.
Pending
AI models will offer significantly improved accuracy in weather pattern prediction.
I think we'll see AI models that can predict weather patterns with much greater accuracy.
1 year ago
Pending
AI models will offer significantly improved accuracy in weather pattern prediction.
I think we'll see AI models that can predict weather patterns with much greater accuracy.
Pending
AI will accelerate the discovery of new drugs and treatments.
And discover new drugs and treatments at an unprecedented rate.
1 year ago
Pending
AI will accelerate the discovery of new drugs and treatments.
And discover new drugs and treatments at an unprecedented rate.
Pending
AI systems will achieve greater accuracy than humans in disease diagnosis.
I think we'll see AI systems that can diagnose diseases with greater accuracy than humans.
1 year ago
Pending
AI systems will achieve greater accuracy than humans in disease diagnosis.
I think we'll see AI systems that can diagnose diseases with greater accuracy than humans.
Pending
AI will contribute to solving major global challenges such as climate change and disease within the next 5-10 years.
I think in the next 5 to 10 years, we'll see AI contributing to solving some of the world's biggest challenges, like climate change and disease.
1 year ago
Pending
AI will contribute to solving major global challenges such as climate change and disease within the next 5-10 years.
I think in the next 5 to 10 years, we'll see AI contributing to solving some of the world's biggest challenges, like climate change and disease.
Pending
Humans will need to adapt and learn new skills to collaborate with AI.
We'll need to adapt and learn new skills to work alongside AI.
1 year ago
Pending
Humans will need to adapt and learn new skills to collaborate with AI.
We'll need to adapt and learn new skills to work alongside AI.
Pending
AI will change the nature of many jobs, though not replace all of them.
I'm not saying that AI will replace all jobs, but it will definitely change the nature of many jobs.
1 year ago
Pending
AI will change the nature of many jobs, though not replace all of them.
I'm not saying that AI will replace all jobs, but it will definitely change the nature of many jobs.
Pending
Expect a surge of new AI-centric startups and businesses.
So, I think we're going to see a lot of new startups and businesses emerge that are built around AI technologies.
1 year ago
Pending
Expect a surge of new AI-centric startups and businesses.
So, I think we're going to see a lot of new startups and businesses emerge that are built around AI technologies.
Pending
AI will democratize innovation, increasing accessibility.
And that's going to democratize innovation, making it accessible to more people.
1 year ago
Pending
AI will democratize innovation, increasing accessibility.
And that's going to democratize innovation, making it accessible to more people.
Pending
AI will be capable of writing code, generating content, and designing products within the next couple of years.
I think we're going to see AI starting to write code, generate content, and even design products in the next couple of years.
1 year ago
Pending
AI will be capable of writing code, generating content, and designing products within the next couple of years.
I think we're going to see AI starting to write code, generate content, and even design products in the next couple of years.
Pending
Specialized AI models for specific tasks/industries will emerge.
And that will probably lead to even more specialized AI models that are built for very specific tasks or industries.
1 year ago
Pending
Specialized AI models for specific tasks/industries will emerge.
And that will probably lead to even more specialized AI models that are built for very specific tasks or industries.
Pending
AI will become significantly more personalized.
I think we're going to see AI become a lot more personalized.
1 year ago
Pending
AI will become significantly more personalized.
I think we're going to see AI become a lot more personalized.
Pending
AI will fundamentally change work, learning, and creation.
And that's going to change how we work, how we learn, how we create.
1 year ago
Pending
AI will fundamentally change work, learning, and creation.
And that's going to change how we work, how we learn, how we create.
Pending
AI will be integrated into daily tools and workflows in unimaginable ways soon.
I think we'll see AI starting to be integrated into a lot of our daily tools and workflows in ways that we just can't even imagine right now.
1 year ago
Pending
AI will be integrated into daily tools and workflows in unimaginable ways soon.
I think we'll see AI starting to be integrated into a lot of our daily tools and workflows in ways that we just can't even imagine right now.
Pending
Expect significant AI breakthroughs within the next 12-18 months.
I think we're going to see significant breakthroughs in AI in the next 12 to 18 months.
1 year ago
Pending
Expect significant AI breakthroughs within the next 12-18 months.
I think we're going to see significant breakthroughs in AI in the next 12 to 18 months.
Pending
In a downtrend, the 0.618 Fibonacci level can indicate a continuation of the downward trend after a retracement.
So here you can see our 0.618 point that came out to be a continuation trend.
1 year ago
Pending
In a downtrend, the 0.618 Fibonacci level can indicate a continuation of the downward trend after a retracement.
So here you can see our 0.618 point that came out to be a continuation trend.
Pending
In an uptrend, if the market retraces to the 0.382 Fibonacci level, it is likely to continue its upward movement from that point.
So, the market took a retracement up to here. Then, after that, look, our point was 0.382. From there, the market again started moving in the continuous upward direction. Yes or no?
1 year ago
Pending
In an uptrend, if the market retraces to the 0.382 Fibonacci level, it is likely to continue its upward movement from that point.
So, the market took a retracement up to here. Then, after that, look, our point was 0.382. From there, the market again started moving in the continuous upward direction. Yes or no?
Pending
A combination of support levels, Fibonacci levels, and chart patterns like the Morning Star can provide strong buy signals, leading to market continuation.
First thing, you can identify a support level here. As we all know, we always study the market. So in the market, you got a support level, plus you got this Fibonacci level. These are two of our points, which means that here we got two confirmations. We got the third confirmation of the morning star. After that, as soon as we saw a green candle, after that we took the entry. And after taking the entry, you can see that the continuous market has gone up.
1 year ago
Pending
A combination of support levels, Fibonacci levels, and chart patterns like the Morning Star can provide strong buy signals, leading to market continuation.
First thing, you can identify a support level here. As we all know, we always study the market. So in the market, you got a support level, plus you got this Fibonacci level. These are two of our points, which means that here we got two confirmations. We got the third confirmation of the morning star. After that, as soon as we saw a green candle, after that we took the entry. And after taking the entry, you can see that the continuous market has gone up.
Pending
90% of the time, market reversals will occur at Fibonacci levels of 0.236, 0.382, or 0.5.
Always most of the time, 90 percent of the time. It will, what it will do is it will only reverse from these points, 0.236, 0.382 or 0.5.
1 year ago
Pending
90% of the time, market reversals will occur at Fibonacci levels of 0.236, 0.382, or 0.5.
Always most of the time, 90 percent of the time. It will, what it will do is it will only reverse from these points, 0.236, 0.382 or 0.5.
Pending
In strong market trends with small retracements, the key Fibonacci levels to watch for continuation are 0.236, 0.382, and 0.5.
So the first thing, when a particular chart is moving in this direction, as you can see, when there is a big trend or when there is a strong move, like if we break it here, It went up like this, then it came down, then up, then down, then up. Where the retracements are very small, where the retracement or the market rend is very strong, where the market trend is strong, meaning if the market is going up, then it is going very fast, or if it is going down, then it is going down very fast, there you will use 0.236, which is our first level. And 0.382 and 0.5. These three levels will be useful to you.
1 year ago
Pending
In strong market trends with small retracements, the key Fibonacci levels to watch for continuation are 0.236, 0.382, and 0.5.
So the first thing, when a particular chart is moving in this direction, as you can see, when there is a big trend or when there is a strong move, like if we break it here, It went up like this, then it came down, then up, then down, then up. Where the retracements are very small, where the retracement or the market rend is very strong, where the market trend is strong, meaning if the market is going up, then it is going very fast, or if it is going down, then it is going down very fast, there you will use 0.236, which is our first level. And 0.382 and 0.5. These three levels will be useful to you.
Pending
In strong, fast-moving trends (up or down), reversals are more likely to occur at Fibonacci levels of 0.236 and 0.382. For larger, less rapid movements, reversals are more likely at 0.618 and 0.786.
When there is a strong upward movement Means when the market is going up very fast Or when the market is going down very fast Then always the reversals that will come That will be in from 0.236 and 0.382 And when there are big movements When you are getting to see big movements in the market You 0.382 When there is an uptrend in this direction in the market or a downtrend in this direction, then the reversals that you will see will be seen from 0.618 and 0.786.
1 year ago
Pending
In strong, fast-moving trends (up or down), reversals are more likely to occur at Fibonacci levels of 0.236 and 0.382. For larger, less rapid movements, reversals are more likely at 0.618 and 0.786.
When there is a strong upward movement Means when the market is going up very fast Or when the market is going down very fast Then always the reversals that will come That will be in from 0.236 and 0.382 And when there are big movements When you are getting to see big movements in the market You 0.382 When there is an uptrend in this direction in the market or a downtrend in this direction, then the reversals that you will see will be seen from 0.618 and 0.786.
Pending
If Fibonacci levels 0.6 or higher are broken in an uptrend, it signals a potential reversal to a downtrend. Conversely, if key upward levels are broken in a downtrend, it suggests a reversal to an uptrend.
So as soon as it breaks 0.6. It has broken 0.6. This means that there is a chance of a reversal. Retracement is over. Instead of going upward, the market will continue down. Or if the market is going downward, and we took it up. 1 break, 2 break, 3 break, 4 break, then break, so it means the market can reverse and go now.
1 year ago
Pending
If Fibonacci levels 0.6 or higher are broken in an uptrend, it signals a potential reversal to a downtrend. Conversely, if key upward levels are broken in a downtrend, it suggests a reversal to an uptrend.
So as soon as it breaks 0.6. It has broken 0.6. This means that there is a chance of a reversal. Retracement is over. Instead of going upward, the market will continue down. Or if the market is going downward, and we took it up. 1 break, 2 break, 3 break, 4 break, then break, so it means the market can reverse and go now.
Pending
A comprehensive trading approach involves learning multiple tools (like candlestick patterns, chart patterns, price action) and using a combination of them for trading decisions, rather than relying on a single method.
Simply put, don't trade only on the basis of candlestick patterns or chart patterns. Learn all three, four, five things, and use two or three things together to trade.
1 year ago
Pending
A comprehensive trading approach involves learning multiple tools (like candlestick patterns, chart patterns, price action) and using a combination of them for trading decisions, rather than relying on a single method.
Simply put, don't trade only on the basis of candlestick patterns or chart patterns. Learn all three, four, five things, and use two or three things together to trade.
Pending
Combining chart patterns, candlestick patterns, and price action in trading significantly increases the probability of success and profit.
If you trade all three things together, then the chances of your success and profit increase a lot.
1 year ago
Pending
Combining chart patterns, candlestick patterns, and price action in trading significantly increases the probability of success and profit.
If you trade all three things together, then the chances of your success and profit increase a lot.
Pending
Chart patterns are most effective when used in conjunction with other trading indicators and strategies (confluences).
Maximum times it works. What they have to do is to compound. They have to use it like confluences.
1 year ago
Pending
Chart patterns are most effective when used in conjunction with other trading indicators and strategies (confluences).
Maximum times it works. What they have to do is to compound. They have to use it like confluences.
Pending
Chart patterns are not always reliable and should not be the sole basis for trading decisions, as they can be misleading.
Chart patterns are not absolute. What does this mean? You don't have to trade only on the basis of chart patterns. Because chart patterns can deceive you.
1 year ago
Pending
Chart patterns are not always reliable and should not be the sole basis for trading decisions, as they can be misleading.
Chart patterns are not absolute. What does this mean? You don't have to trade only on the basis of chart patterns. Because chart patterns can deceive you.
Pending
A bearish continuation pattern indicates that the downward trend will continue after the pattern's formation.
If the market goes down, then we call it a bearish continuation pattern.
1 year ago
Pending
A bearish continuation pattern indicates that the downward trend will continue after the pattern's formation.
If the market goes down, then we call it a bearish continuation pattern.
Pending
A bullish continuation pattern suggests an upward trend will persist after the pattern's formation.
in the continuation pattern, if the market goes up, then we call it a bullish continuation pattern.
1 year ago
Pending
A bullish continuation pattern suggests an upward trend will persist after the pattern's formation.
in the continuation pattern, if the market goes up, then we call it a bullish continuation pattern.
Pending
A bearish reversal pattern indicates a downward movement following the pattern's appearance.
If the market goes down after the reversal pattern, then we call it a bearish reversal pattern.
1 year ago
Pending
A bearish reversal pattern indicates a downward movement following the pattern's appearance.
If the market goes down after the reversal pattern, then we call it a bearish reversal pattern.
Pending
A bullish reversal pattern signifies an upward movement after the pattern's formation.
If the market goes up, then we call it a bullish reversal pattern.
1 year ago
Pending
A bullish reversal pattern signifies an upward movement after the pattern's formation.
If the market goes up, then we call it a bullish reversal pattern.
Pending
Reversal patterns, when observed during an uptrend, indicate a potential market turnaround and a subsequent downward movement.
If the market goes up and you see this pattern then the market will turn around. Let's assume that this is the reversal pattern. And then it will start coming down.
1 year ago
Pending
Reversal patterns, when observed during an uptrend, indicate a potential market turnaround and a subsequent downward movement.
If the market goes up and you see this pattern then the market will turn around. Let's assume that this is the reversal pattern. And then it will start coming down.
Pending
The size of the cup in the inverse cup and handle pattern is proportional to the potential downward movement in the market.
Similarly, the bigger the cup, the more downward movement in the market.
1 year ago
Pending
The size of the cup in the inverse cup and handle pattern is proportional to the potential downward movement in the market.
Similarly, the bigger the cup, the more downward movement in the market.
Pending
The size of the cup in the cup and handle pattern is proportional to the potential upward movement in the market.
The bigger the cup, the more upward movement in the market.
1 year ago
Pending
The size of the cup in the cup and handle pattern is proportional to the potential upward movement in the market.
The bigger the cup, the more upward movement in the market.
Pending
The inverse cup and handle pattern predicts a rapid downward movement in the market following a breakout.
And then it will break out downwards. In this, the market can go down very fast. Can go down very fast.
1 year ago
Pending
The inverse cup and handle pattern predicts a rapid downward movement in the market following a breakout.
And then it will break out downwards. In this, the market can go down very fast. Can go down very fast.
Pending
The breakout of the handle in the cup and handle pattern signals a continuation of the upward market movement.
As soon as the handle broke, the market continued to run up.
1 year ago
Pending
The breakout of the handle in the cup and handle pattern signals a continuation of the upward market movement.
As soon as the handle broke, the market continued to run up.
Pending
The cup and handle pattern typically appears during a bullish trend, where the market moves upwards, forms a cup, and then continues upward.
Remember one thing about the cup and handle pattern, that it usually comes in a bullish movement from here. That is, the market will first come from below, then go to the cup, and then go up again.
1 year ago
Pending
The cup and handle pattern typically appears during a bullish trend, where the market moves upwards, forms a cup, and then continues upward.
Remember one thing about the cup and handle pattern, that it usually comes in a bullish movement from here. That is, the market will first come from below, then go to the cup, and then go up again.
Pending
The cup and handle pattern suggests a potential upward breakout, leading to significant upward market movements.
The cup and handle pattern will tell you that the market can break out from here and run up. If it breaks, then you can expect very big movements upwards.
1 year ago
Pending
The cup and handle pattern suggests a potential upward breakout, leading to significant upward market movements.
The cup and handle pattern will tell you that the market can break out from here and run up. If it breaks, then you can expect very big movements upwards.
Pending
Upon breaking the neckline, the inverted head and shoulders pattern leads to a rapid upward movement in the market.
Market, if the neckline breaks Market will go up fast
1 year ago
Pending
Upon breaking the neckline, the inverted head and shoulders pattern leads to a rapid upward movement in the market.
Market, if the neckline breaks Market will go up fast
Pending
The inverted head and shoulders pattern is a bullish signal, suggesting an upward movement in the market.
Because inverted head and shoulders is a bullish pattern I hope you understood
1 year ago
Pending
The inverted head and shoulders pattern is a bullish signal, suggesting an upward movement in the market.
Because inverted head and shoulders is a bullish pattern I hope you understood
Pending
The head and shoulders pattern is completed when the neckline is broken, indicating a bearish market movement and a quick fall.
As soon as he broke the neckline, your head and shoulder pattern is complete and the market is bearish. It means that after the head and shoulder pattern, the market falls down quickly.
1 year ago
Pending
The head and shoulders pattern is completed when the neckline is broken, indicating a bearish market movement and a quick fall.
As soon as he broke the neckline, your head and shoulder pattern is complete and the market is bearish. It means that after the head and shoulder pattern, the market falls down quickly.
Pending
The W pattern leads to a breakout in the upward (green) direction.
W pattern will give breakout in green direction.
1 year ago
Pending
The W pattern leads to a breakout in the upward (green) direction.
W pattern will give breakout in green direction.
Pending
The M pattern results in a downward breakout and subsequent downward movement in the market.
in M pattern market will break out in downward direction and will break down and will move downward means we will make M pattern in red for now to understand Look in which direction, it will give breakout,
1 year ago
Pending
The M pattern results in a downward breakout and subsequent downward movement in the market.
in M pattern market will break out in downward direction and will break down and will move downward means we will make M pattern in red for now to understand Look in which direction, it will give breakout,
Pending
The W pattern, or double bottom, is confirmed when the market breaks the neckline, leading to an upward breakout.
if it breaks this it breaks this it breaks neckline then it means W pattern is successful and in market we will see break out in upward direction
1 year ago
Pending
The W pattern, or double bottom, is confirmed when the market breaks the neckline, leading to an upward breakout.
if it breaks this it breaks this it breaks neckline then it means W pattern is successful and in market we will see break out in upward direction
Pending
The M pattern, also known as the double top, is confirmed when the market breaks the neckline, indicating a potential downward trade.
It becomes m. if the market breaks the neckline, and then goes downward, And then you can take downward trade on the m pattern,
1 year ago
Pending
The M pattern, also known as the double top, is confirmed when the market breaks the neckline, indicating a potential downward trade.
It becomes m. if the market breaks the neckline, and then goes downward, And then you can take downward trade on the m pattern,
Pending
A bearish pennant pattern results in a downward breakout.
Then it will break out in the downward direction Okay, I hope you understood
1 year ago
Pending
A bearish pennant pattern results in a downward breakout.
Then it will break out in the downward direction Okay, I hope you understood
Pending
The pennant pattern forms a triangular shape resembling an 'X', followed by an upward market breakout.
The market has drawn a very triangular pattern Which becomes an X And then the market breaks out upwards
1 year ago
Pending
The pennant pattern forms a triangular shape resembling an 'X', followed by an upward market breakout.
The market has drawn a very triangular pattern Which becomes an X And then the market breaks out upwards
Pending
A bearish pennant pattern is characterized by a downward breakout from a triangular formation, leading to a downward market movement.
What will happen in bearish peanut? The market will keep coming down. Then it will go to a zone like this. And it will give us a triangle, something like this. And then the market will again break out in the downward direction and run upwards.
1 year ago
Pending
A bearish pennant pattern is characterized by a downward breakout from a triangular formation, leading to a downward market movement.
What will happen in bearish peanut? The market will keep coming down. Then it will go to a zone like this. And it will give us a triangle, something like this. And then the market will again break out in the downward direction and run upwards.
Pending
A bullish pennant pattern involves an upward breakout after the formation of a triangular pattern, leading to an upward market movement.
In a bullish peanut, the market will run up Down, Up, Down, Up, Down, Up, Down And a triangle will be formed, after which the market will break out in the upward direction and run upwards. Breakout will occur and the market will go upwards.
1 year ago
Pending
A bullish pennant pattern involves an upward breakout after the formation of a triangular pattern, leading to an upward market movement.
In a bullish peanut, the market will run up Down, Up, Down, Up, Down, Up, Down And a triangle will be formed, after which the market will break out in the upward direction and run upwards. Breakout will occur and the market will go upwards.
Pending
A pennant pattern, characterized by a breakout, can lead to profitable trades.
The market came up, up, up, up, whatever it is, X, Y, Z and gave a breakout. As soon as this level was given a breakout, you can make a profit on our penance or take a trade in penance.
1 year ago
Pending
A pennant pattern, characterized by a breakout, can lead to profitable trades.
The market came up, up, up, up, whatever it is, X, Y, Z and gave a breakout. As soon as this level was given a breakout, you can make a profit on our penance or take a trade in penance.
Pending
A falling wedge pattern occurs when the market declines and forms a wedge shape.
The market fell from above, after which a wedge pattern was seen. this is our falling wedge
1 year ago
Pending
A falling wedge pattern occurs when the market declines and forms a wedge shape.
The market fell from above, after which a wedge pattern was seen. this is our falling wedge
Pending
A bullish wedge is formed when the market ascends within a converging zone.
The market is coming up from below. Trapped inside a zone which is getting closer, this is our bullish wedge.
1 year ago
Pending
A bullish wedge is formed when the market ascends within a converging zone.
The market is coming up from below. Trapped inside a zone which is getting closer, this is our bullish wedge.
Pending
A bearish wedge pattern emerges when the market declines and its trendlines converge.
If the market is falling from above and then getting stuck in the wedge, that is a bearish wedge.
1 year ago
Pending
A bearish wedge pattern emerges when the market declines and its trendlines converge.
If the market is falling from above and then getting stuck in the wedge, that is a bearish wedge.
Pending
A bullish wedge pattern is formed when the market ascends and its trendlines converge.
If the market is coming from below and then doing this, then this is a bullish wedge.
1 year ago
Pending
A bullish wedge pattern is formed when the market ascends and its trendlines converge.
If the market is coming from below and then doing this, then this is a bullish wedge.
Pending
A bearish wedge forms when trendlines converge, indicating a downward market movement.
What happened here? The market was coming like this. After that, like this, like this. We got to see our lines close to each other. This is our bearish wedge.
1 year ago
Pending
A bearish wedge forms when trendlines converge, indicating a downward market movement.
What happened here? The market was coming like this. After that, like this, like this. We got to see our lines close to each other. This is our bearish wedge.
Pending
A bullish wedge is characterized by converging support and resistance lines within an upward market trend.
And our market is WEG. Wedge is basically a resistance at the top and a resistance at the bottom, which is coming close to each other. Look at this. What happened here? The market was coming like this. After that, like this, like this. We got to see our lines close to each other. This is our bullish wedge.
1 year ago
Pending
A bullish wedge is characterized by converging support and resistance lines within an upward market trend.
And our market is WEG. Wedge is basically a resistance at the top and a resistance at the bottom, which is coming close to each other. Look at this. What happened here? The market was coming like this. After that, like this, like this. We got to see our lines close to each other. This is our bullish wedge.
Pending
In both bearish and bullish wedge patterns, waiting for a breakout is crucial before initiating a trade.
And as soon as it breaks, the market continues to run. So, in both bearish and bullish wedge patterns, you have to wait for the breakout. Again, you have to wait for the breakout. It's not that if you see this wedge pattern, you have to take a trade immediately.
1 year ago
Pending
In both bearish and bullish wedge patterns, waiting for a breakout is crucial before initiating a trade.
And as soon as it breaks, the market continues to run. So, in both bearish and bullish wedge patterns, you have to wait for the breakout. Again, you have to wait for the breakout. It's not that if you see this wedge pattern, you have to take a trade immediately.
Pending
A key characteristic of the wedge pattern is that its trendlines converge, becoming closer to each other.
In WEG? The lines will usually come a little close to each other. You can see here, the lines are coming close to each other. This is our WEDGE pattern.
1 year ago
Pending
A key characteristic of the wedge pattern is that its trendlines converge, becoming closer to each other.
In WEG? The lines will usually come a little close to each other. You can see here, the lines are coming close to each other. This is our WEDGE pattern.
Pending
A bearish wedge pattern is identified when the market is declining and forms a wedge shape.
If the market is falling from above and then getting stuck in the wedge, that is a bearish wedge.
1 year ago
Pending
A bearish wedge pattern is identified when the market is declining and forms a wedge shape.
If the market is falling from above and then getting stuck in the wedge, that is a bearish wedge.
Pending
A bullish wedge pattern occurs when converging resistance and support lines are observed, and the market is moving upwards.
And our market is WEG. Wedge is basically a resistance at the top and a resistance at the bottom, which is coming close to each other. Look at this. What happened here? The market was coming like this. After that, like this, like this. We got to see our lines close to each other. This is our bullish wedge. What happens in a bullish wedge? The benefit of a bullish wedge is simple. If the market is coming from below and then doing this, then this is a bullish wedge.
1 year ago
Pending
A bullish wedge pattern occurs when converging resistance and support lines are observed, and the market is moving upwards.
And our market is WEG. Wedge is basically a resistance at the top and a resistance at the bottom, which is coming close to each other. Look at this. What happened here? The market was coming like this. After that, like this, like this. We got to see our lines close to each other. This is our bullish wedge. What happens in a bullish wedge? The benefit of a bullish wedge is simple. If the market is coming from below and then doing this, then this is a bullish wedge.
Pending
In a bullish wedge pattern, it is crucial to wait for a breakout above major resistance levels, as a slight initial breakout can be deceptive.
As soon as there is a breakout, you don't have to take entry, because many people get stuck here. What does the market do sometimes? This is a wedge pattern, the market gave a slight breakout, but hen the market comes back down. What you have to do is always wait for this level, where the major resistance levels are, all the old highs, not all the old ones, but the major ones, I am considering this as the major one. If this is broken, then the market will run after this, that is what we usually consider.
1 year ago
Pending
In a bullish wedge pattern, it is crucial to wait for a breakout above major resistance levels, as a slight initial breakout can be deceptive.
As soon as there is a breakout, you don't have to take entry, because many people get stuck here. What does the market do sometimes? This is a wedge pattern, the market gave a slight breakout, but hen the market comes back down. What you have to do is always wait for this level, where the major resistance levels are, all the old highs, not all the old ones, but the major ones, I am considering this as the major one. If this is broken, then the market will run after this, that is what we usually consider.
Pending
The wedge pattern is characterized by converging trendlines, indicating a gradual movement towards a breakout.
In the wedge pattern, the market will be kind to you little by little It will keep coming closer, little by little, and then slowly, sometimes, there will be touch. that is what the wedge pattern is about.
1 year ago
Pending
The wedge pattern is characterized by converging trendlines, indicating a gradual movement towards a breakout.
In the wedge pattern, the market will be kind to you little by little It will keep coming closer, little by little, and then slowly, sometimes, there will be touch. that is what the wedge pattern is about.
Pending
A bearish flag pattern suggests a continued downward trend in the market.
The flag that is sinking, meaning the flag that is going down, will go deeper into the ground.
1 year ago
Pending
A bearish flag pattern suggests a continued downward trend in the market.
The flag that is sinking, meaning the flag that is going down, will go deeper into the ground.
Pending
A bullish flag pattern signifies an upward movement in the market.
Bullish flag means the market will run up.
1 year ago
Pending
A bullish flag pattern signifies an upward movement in the market.
Bullish flag means the market will run up.
Pending
A bearish flag pattern indicates that the market is expected to move downwards.
Bearish flag means the market will run down.
1 year ago
Pending
A bearish flag pattern indicates that the market is expected to move downwards.
Bearish flag means the market will run down.
Pending
A future video will be created to cover additional important candlestick patterns.
I will try to write one more video where the remaining important patterns are there
1 year ago
Pending
A future video will be created to cover additional important candlestick patterns.
I will try to write one more video where the remaining important patterns are there
Pending
A bullish flag pattern suggests that the market will continue its upward trend.
Bullish flag means the market is running up. The market will run up.
1 year ago
Pending
A bullish flag pattern suggests that the market will continue its upward trend.
Bullish flag means the market is running up. The market will run up.
Pending
The options chain, including elements like BIDASC, PCR ratio, change in OI, and volume, will be covered in future lectures.
This is called options chain. This is called options chain, nifty options BIDASC, what is BIDASC PCR ratio, what is change in UI, what is volume. We will study all these things slowly.
1 year ago
Pending
The options chain, including elements like BIDASC, PCR ratio, change in OI, and volume, will be covered in future lectures.
This is called options chain. This is called options chain, nifty options BIDASC, what is BIDASC PCR ratio, what is change in UI, what is volume. We will study all these things slowly.
Pending
The bearish flag pattern involves a downward movement where the market forms an inverted flag and then breaks out downwards.
First, it comes down and forms a pole. See, this is our pole, okay? And this time, we'll see an upside down flag. Look carefully, this looks like an upside down flag. Then, the market goes up, down, up, down, and gives a break out in the downward direction. And after giving a break out in the downward direction, it ravels downwards continuously.
1 year ago
Pending
The bearish flag pattern involves a downward movement where the market forms an inverted flag and then breaks out downwards.
First, it comes down and forms a pole. See, this is our pole, okay? And this time, we'll see an upside down flag. Look carefully, this looks like an upside down flag. Then, the market goes up, down, up, down, and gives a break out in the downward direction. And after giving a break out in the downward direction, it ravels downwards continuously.
Pending
The speaker claims to have covered all essential candlestick patterns in the video.
I have covered all the important ones
1 year ago
Pending
The speaker claims to have covered all essential candlestick patterns in the video.
I have covered all the important ones
Pending
The bullish flag pattern indicates an upward movement where the market breaks through resistance after forming a pole and a flag.
In which the market went up first. Ok, the market went up, a pole was made, a simple pole was made here. After that, the market took up, down, up, down, many such movements. That's why this upper line is our resistance. Okay, and the one that went down, this is our support. After that, the market breaks the resistance and runs up. This is what the bullish flag pattern indicates.
1 year ago
Pending
The bullish flag pattern indicates an upward movement where the market breaks through resistance after forming a pole and a flag.
In which the market went up first. Ok, the market went up, a pole was made, a simple pole was made here. After that, the market took up, down, up, down, many such movements. That's why this upper line is our resistance. Okay, and the one that went down, this is our support. After that, the market breaks the resistance and runs up. This is what the bullish flag pattern indicates.
Pending
Sensible is considered a top-tier option analytics platform, offering a trial period for users.
And the third one You have one more option available That is sensible This, uh, this is one of the best options, but this is not a free one. It will give you a trial.
1 year ago
Pending
Sensible is considered a top-tier option analytics platform, offering a trial period for users.
And the third one You have one more option available That is sensible This, uh, this is one of the best options, but this is not a free one. It will give you a trial.
Pending
A price action trading course will be released only after this video achieves 10,000 likes.
When we reach 10, 000 likes on this video, then only we are going to bring the next course that is price action trading course.
1 year ago
Pending
A price action trading course will be released only after this video achieves 10,000 likes.
When we reach 10, 000 likes on this video, then only we are going to bring the next course that is price action trading course.
Pending
A flag pattern is considered complete upon a downward breakout.
And after this, if it breaks out downwards, then our flag pattern is complete.
1 year ago
Pending
A flag pattern is considered complete upon a downward breakout.
And after this, if it breaks out downwards, then our flag pattern is complete.
Pending
The speaker questions whether a specific candle formation (red, small red, then large red followed by a small red candle) after an uptrend constitutes the 'three red soldiers' pattern, implying a potential market decline.
So the market is going up. What happened in the market? After that, a red candle came again. Let's say, a small candle came. Then after that, there was a very big candle like this. Then after that, there was a small candle like this. Are these our three red soldiers or not?
1 year ago
Pending
The speaker questions whether a specific candle formation (red, small red, then large red followed by a small red candle) after an uptrend constitutes the 'three red soldiers' pattern, implying a potential market decline.
So the market is going up. What happened in the market? After that, a red candle came again. Let's say, a small candle came. Then after that, there was a very big candle like this. Then after that, there was a small candle like this. Are these our three red soldiers or not?
Pending
Nifty Trader is recommended as a free platform to view options Greeks such as IV, strike price, and Delta.
Instead of that, the better free option is this Nifty Trader. Okay. Open Nifty Trader in a new app, in a new tab. In this, you will be able to see simply. IV is visible, strike price is visible. Then after this, Delta is visible. Delta has also been given a dash. It is not on here yet.
1 year ago
Pending
Nifty Trader is recommended as a free platform to view options Greeks such as IV, strike price, and Delta.
Instead of that, the better free option is this Nifty Trader. Okay. Open Nifty Trader in a new app, in a new tab. In this, you will be able to see simply. IV is visible, strike price is visible. Then after this, Delta is visible. Delta has also been given a dash. It is not on here yet.
Pending
The completion of a descending triangle pattern is confirmed when a breakout occurs below the support level, signaling a trading opportunity.
When it gives a breakout below, that's when you think about the trade. When it gives a breakout below like this, that's when our descending triangle is completed.
1 year ago
Pending
The completion of a descending triangle pattern is confirmed when a breakout occurs below the support level, signaling a trading opportunity.
When it gives a breakout below, that's when you think about the trade. When it gives a breakout below like this, that's when our descending triangle is completed.
Pending
A combination of a Fibonacci level (specifically, the speaker highlights the second point, implying a retracement level like 0.382 or 0.5), a support level, and a morning star candlestick pattern provides three confirmations for a potential buying opportunity, leading to an upward market movement.
So here, he came to the second point and took a movement in the upward direction. Plus, we got to see the morning star. This is a potential buying point. As soon as you saw the morning star, you can buy here. Why? There are three confirmations here. Actually, there are two confirmations here. And there is also a third one here. Let me explain to you all three. Now, let me explain to you how to derive all three. First thing, you can identify a support level here. As we all know, we always study the market. So in the market, you got a support level, plus you got this Fibonacci level. These are two of our points, which means that here we got two confirmations. We got the third confirmation of the morning star. After that, as soon as we saw a green candle, after that we took the entry. And after taking the entry, you can see that the continuous market has gone up. Yes or no?
1 year ago
Pending
A combination of a Fibonacci level (specifically, the speaker highlights the second point, implying a retracement level like 0.382 or 0.5), a support level, and a morning star candlestick pattern provides three confirmations for a potential buying opportunity, leading to an upward market movement.
So here, he came to the second point and took a movement in the upward direction. Plus, we got to see the morning star. This is a potential buying point. As soon as you saw the morning star, you can buy here. Why? There are three confirmations here. Actually, there are two confirmations here. And there is also a third one here. Let me explain to you all three. Now, let me explain to you how to derive all three. First thing, you can identify a support level here. As we all know, we always study the market. So in the market, you got a support level, plus you got this Fibonacci level. These are two of our points, which means that here we got two confirmations. We got the third confirmation of the morning star. After that, as soon as we saw a green candle, after that we took the entry. And after taking the entry, you can see that the continuous market has gone up. Yes or no?
Pending
The speaker poses a question about whether a sequence of candles (large, then small, then small) following an uptrend constitutes a '3 red soldier' pattern and implies a potential market downturn if it does.
This time, the market was going up. Then after that, there was a big candle like this in the market. A big soldier came. Then after that a small candle like this came. Then another small candle came. So you have to tell me, this question number 7, 8, whatever name I'm giving. I'm giving 7, I don't remember how many questions were asked before this. Is this a 3 red soldier pattern or not?
1 year ago
Pending
The speaker poses a question about whether a sequence of candles (large, then small, then small) following an uptrend constitutes a '3 red soldier' pattern and implies a potential market downturn if it does.
This time, the market was going up. Then after that, there was a big candle like this in the market. A big soldier came. Then after that a small candle like this came. Then another small candle came. So you have to tell me, this question number 7, 8, whatever name I'm giving. I'm giving 7, I don't remember how many questions were asked before this. Is this a 3 red soldier pattern or not?
Pending
Rising interest rates benefit call options while hurting put options, and vice-versa for falling interest rates.
If the interest rate increases, there will be a profit in the call option. If the interest rate decreases, there will be a loss in the call option. Similarly, the relation with the put option is completely inverse. So, if the interest rate increases, the put option will fall down. And similarly, if the interest rate falls, then the put option holders will get a profit.
1 year ago
Pending
Rising interest rates benefit call options while hurting put options, and vice-versa for falling interest rates.
If the interest rate increases, there will be a profit in the call option. If the interest rate decreases, there will be a loss in the call option. Similarly, the relation with the put option is completely inverse. So, if the interest rate increases, the put option will fall down. And similarly, if the interest rate falls, then the put option holders will get a profit.
Pending
The standard lot size for Nifty options is predicted to be 50.
Like if we talk about Nifty, it has a lot size of 50 usually.
1 year ago
Pending
The standard lot size for Nifty options is predicted to be 50.
Like if we talk about Nifty, it has a lot size of 50 usually.
Pending
A descending triangle pattern breakout can lead to losses, as illustrated by a hypothetical share example.
After the descending triangle pattern, the market gave a breakout. And then you made a loss. Let's say it was a share worth Rs. 30. So, here you made a loss of Rs. 20.
1 year ago
Pending
A descending triangle pattern breakout can lead to losses, as illustrated by a hypothetical share example.
After the descending triangle pattern, the market gave a breakout. And then you made a loss. Let's say it was a share worth Rs. 30. So, here you made a loss of Rs. 20.
Pending
In a downtrend, applying the Fibonacci tool from the highest point to the lowest point helps identify levels where the market might retrace before continuing downwards. The speaker demonstrates this with an example where the 0.618 level led to trend continuation.
So here, what I'll do is, I've selected the Fibonacci tool. Now, because this is a down trend, what I'll do is, I'll capture the highest point. So, this is the lowest point, and then I will pull it in this direction. And here you can see, I have drawn some points here. The first thing was our highest point. After that, our lowest point, that is this. After that, you can see where the reversal happened. The market came in the downward direction. This is downtrend. Retracement, then continuation of trend. So for continuation of trend, the particular point was given by Fibonacci tools. So here you can see our 0.618 point that came out to be a continuation trend.
1 year ago
Pending
In a downtrend, applying the Fibonacci tool from the highest point to the lowest point helps identify levels where the market might retrace before continuing downwards. The speaker demonstrates this with an example where the 0.618 level led to trend continuation.
So here, what I'll do is, I've selected the Fibonacci tool. Now, because this is a down trend, what I'll do is, I'll capture the highest point. So, this is the lowest point, and then I will pull it in this direction. And here you can see, I have drawn some points here. The first thing was our highest point. After that, our lowest point, that is this. After that, you can see where the reversal happened. The market came in the downward direction. This is downtrend. Retracement, then continuation of trend. So for continuation of trend, the particular point was given by Fibonacci tools. So here you can see our 0.618 point that came out to be a continuation trend.
Pending
Rho quantifies the sensitivity of an option's price to changes in the risk-free interest rate.
Rho is basically, it tells you the relation of interest rate, the government interest rate changes.with it you Call options and put options have this relation.
1 year ago
Pending
Rho quantifies the sensitivity of an option's price to changes in the risk-free interest rate.
Rho is basically, it tells you the relation of interest rate, the government interest rate changes.with it you Call options and put options have this relation.
Pending
An inverse hammer pattern appearing after an uptrend suggests a potential market downturn.
After this, It's the same, inverse hammer. Inverse hammer means the hammer kept upside down. It's happened before in bullish patterns as well. Now again, what's this time? Take care. The market will come up the market is running. After that, we get the inverse hammer. After that, the market will fall down.
1 year ago
Pending
An inverse hammer pattern appearing after an uptrend suggests a potential market downturn.
After this, It's the same, inverse hammer. Inverse hammer means the hammer kept upside down. It's happened before in bullish patterns as well. Now again, what's this time? Take care. The market will come up the market is running. After that, we get the inverse hammer. After that, the market will fall down.
Pending
The speaker predicts that the percentage of profitable traders in options buying is very low.
In options trading, especially in options buying, the profitable percentage is very low.
1 year ago
Pending
The speaker predicts that the percentage of profitable traders in options buying is very low.
In options trading, especially in options buying, the profitable percentage is very low.
Pending
In an uptrend, applying the Fibonacci tool from the lowest point to the highest point reveals levels (0.236, 0.382, 0.5, 0.618, 0.786) where the market might retrace before continuing its upward trend. The speaker shows an example where the market continued upwards after retracing to the 0.382 level.
So, I've just covered the lowest point. What exactly happened here? I'm not here to prepare anything, I'm not here to take old charts or screenshots, I'm doing it live. All the examples I gave are from exactly the same point. So what did you see what I did? I clicked on the lowest point, meaning whenever there is an uptrend, So in the Fibonacci tool, you will click on the first point at the bottom and you will take it to the point at the top. Then it will tell you the levels. So from here, the market went continuously upward. As you guys can see, it went continuously upward from here. Then after that, the market took a small fall. Okay? So this is retracement. There is a small retracement retracement has come or how far it can come. So this is one point, it told you one. Right there. This is one potential point, this is two, this is three, this is four, and this is five. I told you about five points, I told you about 0.238. 0.382, 0.5, 0.618, and 0.786, 786. You have to keep these 5 numbers in mind. So, these 5 points tell us where the market can continue again the direction of the trend. So, the market took a retracement up to here. Then, after that, look, our point was 0.382. From there, the market again started moving in the continuous upward direction. Yes or no?
1 year ago
Pending
In an uptrend, applying the Fibonacci tool from the lowest point to the highest point reveals levels (0.236, 0.382, 0.5, 0.618, 0.786) where the market might retrace before continuing its upward trend. The speaker shows an example where the market continued upwards after retracing to the 0.382 level.
So, I've just covered the lowest point. What exactly happened here? I'm not here to prepare anything, I'm not here to take old charts or screenshots, I'm doing it live. All the examples I gave are from exactly the same point. So what did you see what I did? I clicked on the lowest point, meaning whenever there is an uptrend, So in the Fibonacci tool, you will click on the first point at the bottom and you will take it to the point at the top. Then it will tell you the levels. So from here, the market went continuously upward. As you guys can see, it went continuously upward from here. Then after that, the market took a small fall. Okay? So this is retracement. There is a small retracement retracement has come or how far it can come. So this is one point, it told you one. Right there. This is one potential point, this is two, this is three, this is four, and this is five. I told you about five points, I told you about 0.238. 0.382, 0.5, 0.618, and 0.786, 786. You have to keep these 5 numbers in mind. So, these 5 points tell us where the market can continue again the direction of the trend. So, the market took a retracement up to here. Then, after that, look, our point was 0.382. From there, the market again started moving in the continuous upward direction. Yes or no?
Pending
A descending triangle pattern signals a downward breakout and a subsequent fall in market price.
descending means the market will fall downwards, means the market will give a downward break out, and the market's price will fall.
1 year ago
Pending
A descending triangle pattern signals a downward breakout and a subsequent fall in market price.
descending means the market will fall downwards, means the market will give a downward break out, and the market's price will fall.
Pending
The speaker plans to release videos on price action trading, smart money concepts, and ICT in future.
Our next videos are going to be on price action trading course, on smart money concepts trading course and on ICT.
1 year ago
Pending
The speaker plans to release videos on price action trading, smart money concepts, and ICT in future.
Our next videos are going to be on price action trading course, on smart money concepts trading course and on ICT.
Pending
A descending triangle pattern, when it breaks the support level, indicates a further downward movement in the market.
In this, by breaking the support, downwards, means the market falls even more downwards.
1 year ago
Pending
A descending triangle pattern, when it breaks the support level, indicates a further downward movement in the market.
In this, by breaking the support, downwards, means the market falls even more downwards.
Pending
In trends with significant price movements (not necessarily extremely fast), Fibonacci levels 0.618 and 0.786 are key levels to watch for potential reversals.
And when there are big movements When you are getting to see big movements in the market You 0.382 When there is an uptrend in this direction in the market or a downtrend in this direction, then the reversals that you will see will be seen from 0.618 and 0.786.
1 year ago
Pending
In trends with significant price movements (not necessarily extremely fast), Fibonacci levels 0.618 and 0.786 are key levels to watch for potential reversals.
And when there are big movements When you are getting to see big movements in the market You 0.382 When there is an uptrend in this direction in the market or a downtrend in this direction, then the reversals that you will see will be seen from 0.618 and 0.786.
Pending
The speaker plans to release videos on price action trading, smart money concepts, and ICT in future.
Our next videos are going to be on price action trading course, on smart money concepts trading course and on ICT.
1 year ago
Pending
The speaker plans to release videos on price action trading, smart money concepts, and ICT in future.
Our next videos are going to be on price action trading course, on smart money concepts trading course and on ICT.
Pending
Stock options in India have monthly expirations, with the last Thursday of the month being the typical expiry day.
And similarly, if we talk about our Fin Nifty, Bank Nifty, which are indices, they also have different weekly expiry. Okay. For example, if we talk about Nifty, it expires on Thursday. If we talk about Fin Nifty, it expires on Tuesday. If we talk about Bank Nifty, it expires on Wednesday.
1 year ago
Pending
Stock options in India have monthly expirations, with the last Thursday of the month being the typical expiry day.
And similarly, if we talk about our Fin Nifty, Bank Nifty, which are indices, they also have different weekly expiry. Okay. For example, if we talk about Nifty, it expires on Thursday. If we talk about Fin Nifty, it expires on Tuesday. If we talk about Bank Nifty, it expires on Wednesday.
Pending
Gamma measures the rate of change of an option's Delta with respect to a change in the price of the underlying asset.
Gamma again is not very important, but still it is important to understand because you should know everything. Now gamma simply tells you that delta, Delta is a dynamic Greek. Dynamic Greek means, Delta is not fixed. Delta keeps on changing.
1 year ago
Pending
Gamma measures the rate of change of an option's Delta with respect to a change in the price of the underlying asset.
Gamma again is not very important, but still it is important to understand because you should know everything. Now gamma simply tells you that delta, Delta is a dynamic Greek. Dynamic Greek means, Delta is not fixed. Delta keeps on changing.
Pending
Observing a hammer pattern after an uptrend indicates a potential market decline.
This time, the market was going up. The market was running fast. Then after that we saw a hammer pattern. We saw a hammer pattern. It means there is a chance that the market will fall from here.
1 year ago
Pending
Observing a hammer pattern after an uptrend indicates a potential market decline.
This time, the market was going up. The market was running fast. Then after that we saw a hammer pattern. We saw a hammer pattern. It means there is a chance that the market will fall from here.
Pending
The presence of an ascending triangle pattern suggests the market is likely to turn bullish and move upwards.
if you get to see an ascending triangle pattern in the market, it means that he market can go bullish from here and the market can run up from here.
1 year ago
Pending
The presence of an ascending triangle pattern suggests the market is likely to turn bullish and move upwards.
if you get to see an ascending triangle pattern in the market, it means that he market can go bullish from here and the market can run up from here.
Pending
The speaker plans to release videos on price action trading, smart money concepts, and ICT in future.
Our next videos are going to be on price action trading course, on smart money concepts trading course and on ICT.
1 year ago
Pending
The speaker plans to release videos on price action trading, smart money concepts, and ICT in future.
Our next videos are going to be on price action trading course, on smart money concepts trading course and on ICT.
Pending
In strong trends where the market moves very fast upwards or downwards, Fibonacci levels 0.236, 0.382, and 0.5 are particularly useful for predicting potential reversals or continuations.
And when the market is going up, then it is going very fast, or if it is going down, then it is going down very fast, there you will use 0.236, which is our first level. And 0.382 and 0.5. These three levels will be useful to you.
1 year ago
Pending
In strong trends where the market moves very fast upwards or downwards, Fibonacci levels 0.236, 0.382, and 0.5 are particularly useful for predicting potential reversals or continuations.
And when the market is going up, then it is going very fast, or if it is going down, then it is going down very fast, there you will use 0.236, which is our first level. And 0.382 and 0.5. These three levels will be useful to you.
Pending
Vega measures how much an option's premium will change in response to a 1% change in implied volatility of the underlying asset.
Vega basically tells you that with the implied volatility of the market, how much change is there in the price or premium.
1 year ago
Pending
Vega measures how much an option's premium will change in response to a 1% change in implied volatility of the underlying asset.
Vega basically tells you that with the implied volatility of the market, how much change is there in the price or premium.
Pending
A free price action course will be released if this video achieves 10,000 likes.
If 10, 000 likes come on this video, then we will bring the price action course for free of cost.
1 year ago
Pending
A free price action course will be released if this video achieves 10,000 likes.
If 10, 000 likes come on this video, then we will bring the price action course for free of cost.
Pending
The expiry days for Nifty (Thursday), Fin Nifty (Tuesday), and Bank Nifty (Wednesday) are outlined.
Nifty, it expires on Thursday. If we talk about Fin Nifty, it expires on Tuesday. If we talk about Bank Nifty, it expires on Wednesday.
1 year ago
Pending
The expiry days for Nifty (Thursday), Fin Nifty (Tuesday), and Bank Nifty (Wednesday) are outlined.
Nifty, it expires on Thursday. If we talk about Fin Nifty, it expires on Tuesday. If we talk about Bank Nifty, it expires on Wednesday.
Pending
The head and shoulders pattern, upon breaking the neckline, is usually followed by a breakout and a bearish market movement.
As soon as he breaks the neckline a little bit, as soon as the head and shoulder pattern comes, after that, usually we get to see a breakout and the market will immediately run down.
1 year ago
Pending
The head and shoulders pattern, upon breaking the neckline, is usually followed by a breakout and a bearish market movement.
As soon as he breaks the neckline a little bit, as soon as the head and shoulder pattern comes, after that, usually we get to see a breakout and the market will immediately run down.
Pending
A breakout from the top of an ascending triangle pattern can lead to significant profits.
If it gives a breakout from the top here, then the market can run up after this and give you a good profit.
1 year ago
Pending
A breakout from the top of an ascending triangle pattern can lead to significant profits.
If it gives a breakout from the top here, then the market can run up after this and give you a good profit.
Pending
The Fibonacci levels (specifically 0.236, 0.382, 0.5, 0.618, and 0.786) are used to identify potential points where the market will continue its current trend after a retracement.
So, these 5 points tell us where the market can continue again the direction of the trend.
1 year ago
Pending
The Fibonacci levels (specifically 0.236, 0.382, 0.5, 0.618, and 0.786) are used to identify potential points where the market will continue its current trend after a retracement.
So, these 5 points tell us where the market can continue again the direction of the trend.
Pending
The speaker guarantees that upon completion of their course, viewers will not need to purchase any further options trading education.
I will make sure that after the end of this course, you never need to take any course regarding options trading.
1 year ago
Pending
The speaker guarantees that upon completion of their course, viewers will not need to purchase any further options trading education.
I will make sure that after the end of this course, you never need to take any course regarding options trading.
Pending
Theta's decay accelerates as the option's expiration date approaches, eventually reducing the premium to zero by the last day.
As we get closer to the expiry date, Theta increases. That means, if there are 5 days left for the expiry, then Theta will be less. If there are 4 days left, then Theta will increase. If there are 3 days left, then Theta will increase. It increases so much that Theta brings the premium price to 0 till the last day.
1 year ago
Pending
Theta's decay accelerates as the option's expiration date approaches, eventually reducing the premium to zero by the last day.
As we get closer to the expiry date, Theta increases. That means, if there are 5 days left for the expiry, then Theta will be less. If there are 4 days left, then Theta will increase. If there are 3 days left, then Theta will increase. It increases so much that Theta brings the premium price to 0 till the last day.
Pending
A green candle following an ascending triangle pattern signals an upward breakout and potential price increase.
If you see another green candle, it means that the market has broken out upwards and can run up.
1 year ago
Pending
A green candle following an ascending triangle pattern signals an upward breakout and potential price increase.
If you see another green candle, it means that the market has broken out upwards and can run up.
Pending
This video aims to be a comprehensive guide to candlestick patterns, eliminating the need for further viewing on the topic.
After this there will be no need to watch any candlestick video.
1 year ago
Pending
This video aims to be a comprehensive guide to candlestick patterns, eliminating the need for further viewing on the topic.
After this there will be no need to watch any candlestick video.
Pending
A triple top pattern that breaks the neckline predicts an immediate downward market movement.
After the third touch, if we get to see the breakout while breaking the neckline, then the market will immediately run and run down. This will give a breakout in the down.
1 year ago
Pending
A triple top pattern that breaks the neckline predicts an immediate downward market movement.
After the third touch, if we get to see the breakout while breaking the neckline, then the market will immediately run and run down. This will give a breakout in the down.
Pending
If the market breaks the 0.6 Fibonacci level (or subsequent levels in a downtrend), it signals a reversal. In an uptrend, breaking levels 1, 2, 3, or 4 indicates a potential reversal downwards.
As soon as it breaks 0.6. It has broken 0.6. This means that there is a chance of a reversal. Retracement is over. Instead of going upward, the market will continue down. Or if the market is going downward, and we took it up. 1 break, 2 break, 3 break, 4 break, then break, so it means the market can reverse and go now.
1 year ago
Pending
If the market breaks the 0.6 Fibonacci level (or subsequent levels in a downtrend), it signals a reversal. In an uptrend, breaking levels 1, 2, 3, or 4 indicates a potential reversal downwards.
As soon as it breaks 0.6. It has broken 0.6. This means that there is a chance of a reversal. Retracement is over. Instead of going upward, the market will continue down. Or if the market is going downward, and we took it up. 1 break, 2 break, 3 break, 4 break, then break, so it means the market can reverse and go now.
Pending
The speaker anticipates that their 7-8 lecture course will fully cover options trading, making further courses unnecessary.
In the next 7 to 8 lectures, our entire course will be completed. And after this, you will not need any course or anything else.
1 year ago
Pending
The speaker anticipates that their 7-8 lecture course will fully cover options trading, making further courses unnecessary.
In the next 7 to 8 lectures, our entire course will be completed. And after this, you will not need any course or anything else.
Pending
Theta's value increases as the options expiry date approaches, leading to a decrease in premium price, potentially reaching zero by the last day.
As we get closer to the expiry date, Theta increases. That means, if there are 5 days left for the expiry, then Theta will be less. If there are 4 days left, then Theta will increase. If there are 3 days left, then Theta will increase. It increases so much that Theta brings the premium price to 0 till the last day.
1 year ago
Pending
Theta's value increases as the options expiry date approaches, leading to a decrease in premium price, potentially reaching zero by the last day.
As we get closer to the expiry date, Theta increases. That means, if there are 5 days left for the expiry, then Theta will be less. If there are 4 days left, then Theta will increase. If there are 3 days left, then Theta will increase. It increases so much that Theta brings the premium price to 0 till the last day.
Pending
The ascending triangle pattern typically leads to a breakout in the upward direction.
After which the market usually breaks out in the upward direction.
1 year ago
Pending
The ascending triangle pattern typically leads to a breakout in the upward direction.
After which the market usually breaks out in the upward direction.
Pending
A triple bottom pattern, followed by a breakout of the neckline, indicates a potential upward bullish movement in the market.
And after three touches, look, this became our triple bottom. We have already taken three touches on the bottom. We have taken three touches three times on the bottom, it is called a triple bottom. And if you take three touches on the top, it is a triple top. Okay? Now, what does the market do after this? If the market gives a little break out here, then the market gives a break out after this and takes a good movement on the top. It gives a bullish movement.
1 year ago
Pending
A triple bottom pattern, followed by a breakout of the neckline, indicates a potential upward bullish movement in the market.
And after three touches, look, this became our triple bottom. We have already taken three touches on the bottom. We have taken three touches three times on the bottom, it is called a triple bottom. And if you take three touches on the top, it is a triple top. Okay? Now, what does the market do after this? If the market gives a little break out here, then the market gives a break out after this and takes a good movement on the top. It gives a bullish movement.
Pending
A price action course will be released for free if the video reaches 10,000 likes.
If this video gets good likes, let's keep an aim of 10, 000 likes. If this video gets 10, 000 likes, I will get the prize action course for free soon.
1 year ago
Pending
A price action course will be released for free if the video reaches 10,000 likes.
If this video gets good likes, let's keep an aim of 10, 000 likes. If this video gets 10, 000 likes, I will get the prize action course for free soon.
Pending
Theta represents the time value of money for an option, meaning the cost incurred daily for holding the option, which erodes its premium over time.
Theta means, first of all, let me tell you about Theta. We all know that time is money, time is very important. Similarly, we have to give a price for time. So, the price we give for time is called as Theta. It means that you have to pay for what you spend every day.
1 year ago
Pending
Theta represents the time value of money for an option, meaning the cost incurred daily for holding the option, which erodes its premium over time.
Theta means, first of all, let me tell you about Theta. We all know that time is money, time is very important. Similarly, we have to give a price for time. So, the price we give for time is called as Theta. It means that you have to pay for what you spend every day.
Pending
The speaker plans to deliver a 7-8 lecture series on options trading, with the final lectures focusing on live trading and concept implementation.
This will be divided into a series of seven to eight Though which lectures, in which in the last 1 or 2 lectures will be live options, trading, How you can take trades, you know all the remaining concept implementation.
1 year ago
Pending
The speaker plans to deliver a 7-8 lecture series on options trading, with the final lectures focusing on live trading and concept implementation.
This will be divided into a series of seven to eight Though which lectures, in which in the last 1 or 2 lectures will be live options, trading, How you can take trades, you know all the remaining concept implementation.
Pending
A triple top pattern, followed by a break of the neckline, suggests a downward trading opportunity.
After this, if the market comes down and breaks this level, then again you can take a trade for down. This is our triple top.
1 year ago
Pending
A triple top pattern, followed by a break of the neckline, suggests a downward trading opportunity.
After this, if the market comes down and breaks this level, then again you can take a trade for down. This is our triple top.
Pending
The speaker claims their free course is better than many paid courses, implying students won't need to buy further courses after completing this one.
Maybe even paid courses will not be so good because once you see this course till the end, and you will never have to buy any course.
1 year ago
Pending
The speaker claims their free course is better than many paid courses, implying students won't need to buy further courses after completing this one.
Maybe even paid courses will not be so good because once you see this course till the end, and you will never have to buy any course.
Pending
Delta quantifies the expected profit or loss from an option contract based on a 1-point move in the underlying asset.
Delta tells you that if the market moves up or down in any direction, then how much profit or loss will be there.
1 year ago
Pending
Delta quantifies the expected profit or loss from an option contract based on a 1-point move in the underlying asset.
Delta tells you that if the market moves up or down in any direction, then how much profit or loss will be there.
Pending
The speaker expresses doubt that other platforms offer courses as good as theirs for free.
And I highly doubt that on YouTube or any other Instagram, no one will make such a good course for you for free.
1 year ago
Pending
The speaker expresses doubt that other platforms offer courses as good as theirs for free.
And I highly doubt that on YouTube or any other Instagram, no one will make such a good course for you for free.
Pending
The remaining funds in the crypto market are expected to take time to recover after the hack.
the rest has increased so much that it will take time to come back.
1 year ago
Pending
The remaining funds in the crypto market are expected to take time to recover after the hack.
the rest has increased so much that it will take time to come back.
Pending
WazirX Exchange, previously the second-largest crypto exchange in India after Binance, suffered a significant hack, resulting in the loss of funds.
after Binance, this was the biggest crypto exchange in India, and it got hacked so badly that the funds on 50 are gone.
1 year ago
Pending
WazirX Exchange, previously the second-largest crypto exchange in India after Binance, suffered a significant hack, resulting in the loss of funds.
after Binance, this was the biggest crypto exchange in India, and it got hacked so badly that the funds on 50 are gone.
Pending
The speaker predicts a loss of money if it is held on the WazirX Exchange.
If my money is in Wazre Exchange then I am going to lose money.
1 year ago
Pending
The speaker predicts a loss of money if it is held on the WazirX Exchange.
If my money is in Wazre Exchange then I am going to lose money.
Pending
The speaker invested in USDT on April 13th (approximately 2-3 months prior to the video date) and withdrew the funds a month ago, thus avoiding a potential loss of ₹4.50 lakh due to the WazirX hack.
On April 13th, that is, two-three months ago, I invested 0000 I removed it a month ago, I had emptied it, otherwise I also had Rs 4.50 lakh in my account which was about to be hacked and I would not have received it, but luckily yes I was saved
1 year ago
Pending
The speaker invested in USDT on April 13th (approximately 2-3 months prior to the video date) and withdrew the funds a month ago, thus avoiding a potential loss of ₹4.50 lakh due to the WazirX hack.
On April 13th, that is, two-three months ago, I invested 0000 I removed it a month ago, I had emptied it, otherwise I also had Rs 4.50 lakh in my account which was about to be hacked and I would not have received it, but luckily yes I was saved
Pending
It is recommended to wait until the age of 18 before starting to invest, suggesting a period of 2-3 years for study and learning.
I would not suggest you to move ahead before you turn 18, in the next 2 years, 3 years, till you turn 18, study and learn, ... only then go and invest money and make sure you are 18 plus before you start investing
1 year ago
Pending
It is recommended to wait until the age of 18 before starting to invest, suggesting a period of 2-3 years for study and learning.
I would not suggest you to move ahead before you turn 18, in the next 2 years, 3 years, till you turn 18, study and learn, ... only then go and invest money and make sure you are 18 plus before you start investing
Pending
Some countries, such as the UAE, have granted legal status to cryptocurrencies, implying a potentially weaker governmental control over currency issuance.
If you go to Dubai, if you go to the UAE, if you go to Escobar, here or in some countries, even legal status has been given, but there obviously the government is not strong enough
1 year ago
Pending
Some countries, such as the UAE, have granted legal status to cryptocurrencies, implying a potentially weaker governmental control over currency issuance.
If you go to Dubai, if you go to the UAE, if you go to Escobar, here or in some countries, even legal status has been given, but there obviously the government is not strong enough
Pending
The speaker suggests that the Indian government should either completely legalize or completely ban cryptocurrencies to provide clarity for traders and investors.
We want to either legalize it completely or ban it completely. So that we know whether we should do it or not.
1 year ago
Pending
The speaker suggests that the Indian government should either completely legalize or completely ban cryptocurrencies to provide clarity for traders and investors.
We want to either legalize it completely or ban it completely. So that we know whether we should do it or not.
Pending
A significant amount of Indian funds, totaling $13 billion, were held on a single, unnamed cryptocurrency exchange.
And if I may say one more thing, then at the record level, at the record level, 13 billion dollars. An amount of more than $ billion dollars, there is only one cryptocurrency exchange, I won't name it, but there is only one cryptocurrency exchange, which you probably know is very popular. There were funds of the people of India in just one broker, 13 billion dollars in just one platform.
1 year ago
Pending
A significant amount of Indian funds, totaling $13 billion, were held on a single, unnamed cryptocurrency exchange.
And if I may say one more thing, then at the record level, at the record level, 13 billion dollars. An amount of more than $ billion dollars, there is only one cryptocurrency exchange, I won't name it, but there is only one cryptocurrency exchange, which you probably know is very popular. There were funds of the people of India in just one broker, 13 billion dollars in just one platform.
Pending
Indian cryptocurrency brokers currently lack the efficiency and trading volume to effectively execute user orders.
And again, many people because Indian brokers are at the moment not so efficient or not so developed and the volume in them is also not that much, the trading volume is also not that much that your orders can be executed.
1 year ago
Pending
Indian cryptocurrency brokers currently lack the efficiency and trading volume to effectively execute user orders.
And again, many people because Indian brokers are at the moment not so efficient or not so developed and the volume in them is also not that much, the trading volume is also not that much that your orders can be executed.
Pending
The future of cryptocurrency in India is currently uncertain due to regulatory issues, exemplified by the situation with Binance.
the future of crypto is a bit stuck. Once again, look at what happened to Binance.
1 year ago
Pending
The future of cryptocurrency in India is currently uncertain due to regulatory issues, exemplified by the situation with Binance.
the future of crypto is a bit stuck. Once again, look at what happened to Binance.
Pending
In equity trading, if a 10% return is not being achieved, it is advised to exit the investment.
If I am doing equity, then it is important to tell yourself whether I am getting 10% or 10% or not. If I am not getting 10%, then walk out.
1 year ago
Pending
In equity trading, if a 10% return is not being achieved, it is advised to exit the investment.
If I am doing equity, then it is important to tell yourself whether I am getting 10% or 10% or not. If I am not getting 10%, then walk out.
Pending
Traders need to recognize when to exit the market, which is a difficult skill to master. The realization that trading is not suitable for an individual is the cue to stop.
you need to know when to stop. It's something that's very difficult to get out of. ... Once you get used to it, you can never get out. So, you know at the right time when you feel like it's not meant for you. Patience works, you just know it, you yourself realize that no friend, it is not working out, I am not this type of person, then getting out is the right choice
1 year ago
Pending
Traders need to recognize when to exit the market, which is a difficult skill to master. The realization that trading is not suitable for an individual is the cue to stop.
you need to know when to stop. It's something that's very difficult to get out of. ... Once you get used to it, you can never get out. So, you know at the right time when you feel like it's not meant for you. Patience works, you just know it, you yourself realize that no friend, it is not working out, I am not this type of person, then getting out is the right choice
Pending
The speaker notes that high earning potential exists within the job market, citing examples of individuals earning 1 crore and 5 crore packages.
I have seen people with a package of 1 crore, I have seen people with a package of 5 crore
1 year ago
Pending
The speaker notes that high earning potential exists within the job market, citing examples of individuals earning 1 crore and 5 crore packages.
I have seen people with a package of 1 crore, I have seen people with a package of 5 crore
Pending
Earning respect and trust is presented as more challenging and valuable than simply earning money.
it is not difficult to earn only money in life, it is more difficult to earn respect than money and even more difficult to earn trust
1 year ago
Pending
Earning respect and trust is presented as more challenging and valuable than simply earning money.
it is not difficult to earn only money in life, it is more difficult to earn respect than money and even more difficult to earn trust
Pending
The speaker advocates investing only money that one can afford to lose without significant impact on their financial well-being.
invest only that money which, even if you lose, it does not make any difference to you
1 year ago
Pending
The speaker advocates investing only money that one can afford to lose without significant impact on their financial well-being.
invest only that money which, even if you lose, it does not make any difference to you
Pending
Young people are advised to actively seek opportunities, put in hard work, and dream big, rather than waiting for opportunities to come to them.
you have to go out there, you have to work hard, dream big
1 year ago
Pending
Young people are advised to actively seek opportunities, put in hard work, and dream big, rather than waiting for opportunities to come to them.
you have to go out there, you have to work hard, dream big
Pending
If Purab had not become a trader, he would have pursued achievement in another field, potentially staying in the fitness industry where he had a significant social media following at 18.
if I hadn't become a trader, I would have achieved something. I would have never settled for an average person. I was in the fitness industry. I had a 50,000 follower account at 18 years of age.
1 year ago
Pending
If Purab had not become a trader, he would have pursued achievement in another field, potentially staying in the fitness industry where he had a significant social media following at 18.
if I hadn't become a trader, I would have achieved something. I would have never settled for an average person. I was in the fitness industry. I had a 50,000 follower account at 18 years of age.
Pending
Approximately 98% of traders in futures and options experience losses, with only 2% being profitable. Within option trading, 93% incur losses.
the statistics are on the basis of the statistics on 998% of the traders who traded in FAO and options in futures are in loss only 2% are profitable, out of that also 93% loss in option trading, so you tell me 2% now when trading success is a distant thing or if trading is profitable, profitable means if there is a capital of even lakh rupees, there is a profit of even 000 or even 00, that is still counted as profit, then 98% are in negative
1 year ago
Pending
Approximately 98% of traders in futures and options experience losses, with only 2% being profitable. Within option trading, 93% incur losses.
the statistics are on the basis of the statistics on 998% of the traders who traded in FAO and options in futures are in loss only 2% are profitable, out of that also 93% loss in option trading, so you tell me 2% now when trading success is a distant thing or if trading is profitable, profitable means if there is a capital of even lakh rupees, there is a profit of even 000 or even 00, that is still counted as profit, then 98% are in negative
Pending
It is possible to achieve up to 20% profit in a single day through Forex trading.
In Forex trading, even that much can happen in a single day, but in a single day, your profit can be 20%.
1 year ago
Pending
It is possible to achieve up to 20% profit in a single day through Forex trading.
In Forex trading, even that much can happen in a single day, but in a single day, your profit can be 20%.
Pending
The US dollar's exchange rate has seen minimal movement of only ₹1 over the past two to three months.
for the last two-three months, the rate of the US dollar has changed only by ₹.
1 year ago
Pending
The US dollar's exchange rate has seen minimal movement of only ₹1 over the past two to three months.
for the last two-three months, the rate of the US dollar has changed only by ₹.
Pending
Certain brokers are mentioned as offering leverage up to and potentially exceeding 400 times.
I have heard that 400 times is the maximum leverage. Some brokers provide it even more than 400.
1 year ago
Pending
Certain brokers are mentioned as offering leverage up to and potentially exceeding 400 times.
I have heard that 400 times is the maximum leverage. Some brokers provide it even more than 400.
Pending
The speaker advises against beginners starting directly with Forex trading due to its lucrative but potentially overwhelming nature, especially with high leverage.
My opinion is different. According to me, no one should start directly with Forex because Forex is very, what can I say, lucrative. It is a bit lucrative because here, if you are getting leverage, then they are getting 100 times the amount or 500 times the amount, or even 50 times. If so, then a beginner does not know how to manage it.
1 year ago
Pending
The speaker advises against beginners starting directly with Forex trading due to its lucrative but potentially overwhelming nature, especially with high leverage.
My opinion is different. According to me, no one should start directly with Forex because Forex is very, what can I say, lucrative. It is a bit lucrative because here, if you are getting leverage, then they are getting 100 times the amount or 500 times the amount, or even 50 times. If so, then a beginner does not know how to manage it.
Pending
A cautionary tale is presented where a friend lost a significant amount of money (lakhs of rupees) in a single day due to directly starting Forex trading without proper experience or fund management.
My suggestion would be that if you are confident that you can control and manage your funds properly, then only go for it because a friend of mine, I will honestly tell you, lost lakhs of rupees in a single day just because he started trading in Forex directly.
1 year ago
Pending
A cautionary tale is presented where a friend lost a significant amount of money (lakhs of rupees) in a single day due to directly starting Forex trading without proper experience or fund management.
My suggestion would be that if you are confident that you can control and manage your funds properly, then only go for it because a friend of mine, I will honestly tell you, lost lakhs of rupees in a single day just because he started trading in Forex directly.
Pending
The speaker dedicated six months to intensive, round-the-clock study of trading through various media like videos, books, and PDFs.
I focused on studying a lot, day and night. The bug that had gotten into my head, day and night, I would watch videos all night, study all night, read books all night, read e-books, read PDFs, I would do the same thing all day and night.
1 year ago
Pending
The speaker dedicated six months to intensive, round-the-clock study of trading through various media like videos, books, and PDFs.
I focused on studying a lot, day and night. The bug that had gotten into my head, day and night, I would watch videos all night, study all night, read books all night, read e-books, read PDFs, I would do the same thing all day and night.
Pending
The speaker purchased the gym they previously worked at, thereby expanding into a physical business.
the one who used to work in the gym, I went to the gym owner and I bought the gym, the one who used to work in the gym, I bought the gym and then after that a physical business also started
1 year ago
Pending
The speaker purchased the gym they previously worked at, thereby expanding into a physical business.
the one who used to work in the gym, I went to the gym owner and I bought the gym, the one who used to work in the gym, I bought the gym and then after that a physical business also started
Pending
The speaker took a six-month break from trading to dedicate to self-study and gain confidence, aiming to reach a level where they could critically assess their past trading abilities.
I took a six-month break. I had saved the remaining ₹20,000 from the last time I invested. I said, I'll keep it aside and invest it only when I'm confident that I'm the kind of trader who would have said to a trader two years ago, 'This guy is a jerk.' Looking at the trader from a year ago or six months ago, I'd say, 'He's a jerk.' I wanted to become a trader who, looking back a month or two, could say, 'He doesn't know how to trade.' So, I focused on studying a lot, day and night.
1 year ago
Pending
The speaker took a six-month break from trading to dedicate to self-study and gain confidence, aiming to reach a level where they could critically assess their past trading abilities.
I took a six-month break. I had saved the remaining ₹20,000 from the last time I invested. I said, I'll keep it aside and invest it only when I'm confident that I'm the kind of trader who would have said to a trader two years ago, 'This guy is a jerk.' Looking at the trader from a year ago or six months ago, I'd say, 'He's a jerk.' I wanted to become a trader who, looking back a month or two, could say, 'He doesn't know how to trade.' So, I focused on studying a lot, day and night.
Pending
The speaker plans to open a trading institute, aiming to create Maharashtra's best trading coaching center.
And I am now going to open a trading institute, maybe you guys will get to see Maharashtra's best trading coaching center. I am not even saying Nagpur, I live in Nagpur, a city called Nagpur, but it is possible that you guys get to see Maharashtra's best trading coaching center, so be ready for that, be ready for that, everyone.
1 year ago
Pending
The speaker plans to open a trading institute, aiming to create Maharashtra's best trading coaching center.
And I am now going to open a trading institute, maybe you guys will get to see Maharashtra's best trading coaching center. I am not even saying Nagpur, I live in Nagpur, a city called Nagpur, but it is possible that you guys get to see Maharashtra's best trading coaching center, so be ready for that, be ready for that, everyone.
Pending
3 years ago
Construction has started on a bungalow in the speaker's office town, and it will take time to complete both their houses.
I have started construction of a bungalow in the town where my office is located, in that city too. So, it will take some time for both our houses to be built.
2 years ago
Pending
Construction has started on a bungalow in the speaker's office town, and it will take time to complete both their houses.
I have started construction of a bungalow in the town where my office is located, in that city too. So, it will take some time for both our houses to be built.
Pending
The speaker has acquired a car and will use it to fulfill Siddhant's dream within a few months.
I have got this car now. Within a few months, within some time, friend, I will fulfill Siddhant's dream too.
2 years ago
Pending
The speaker has acquired a car and will use it to fulfill Siddhant's dream within a few months.
I have got this car now. Within a few months, within some time, friend, I will fulfill Siddhant's dream too.
Pending
The speaker intends to take their parents around the world.
We will take them around the world
2 years ago
Pending
The speaker intends to take their parents around the world.
We will take them around the world
Pending
The speaker promises to fulfill Siddhant's dream of driving a sports car together, implying a future purchase or shared experience.
I will fulfill Siddhant's dream too. We both will drive cars together, will go in a sports car together.
2 years ago
Pending
The speaker promises to fulfill Siddhant's dream of driving a sports car together, implying a future purchase or shared experience.
I will fulfill Siddhant's dream too. We both will drive cars together, will go in a sports car together.
Pending
The speaker and their friend Siddhant planned to buy a sports car together within two years of December 24, 2021.
on 24 December 2021 that we both would go and buy a sports car together within the next two years, we would purchase it together.
2 years ago
Pending
The speaker and their friend Siddhant planned to buy a sports car together within two years of December 24, 2021.
on 24 December 2021 that we both would go and buy a sports car together within the next two years, we would purchase it together.
Pending
A minimum of one year of stock market experience is recommended before engaging in options and derivative trading.
you should have at least one year of experience in the stock market, so as to jump into options and any kind of derivative trading.
2 years ago
Pending
A minimum of one year of stock market experience is recommended before engaging in options and derivative trading.
you should have at least one year of experience in the stock market, so as to jump into options and any kind of derivative trading.
Pending
4 years ago
The stock market or trading can yield a monthly return of 10-20% with the right knowledge, time, and experience.
If we talk about stock market or trading, then there you can get a monthly return of 10 to 20%.
3 years ago
Pending
The stock market or trading can yield a monthly return of 10-20% with the right knowledge, time, and experience.
If we talk about stock market or trading, then there you can get a monthly return of 10 to 20%.
Pending
Prediction Statistics by Year
Year
Total
Correct
Wrong
Pending
Unrated
Accuracy
2025
Total
19
Correct
0
Wrong
0
Pending
19
Unrated
0
Accuracy
N/A
2025
19
0
0
19
0
N/A
2024
Total
568
Correct
0
Wrong
0
Pending
568
Unrated
0
Accuracy
N/A
2024
568
0
0
568
0
N/A
2023
Total
6
Correct
0
Wrong
0
Pending
6
Unrated
0
Accuracy
N/A
2023
6
0
0
6
0
N/A
2022
Total
1
Correct
0
Wrong
0
Pending
1
Unrated
0
Accuracy
N/A
2022
1
0
0
1
0
N/A
Recent Videos
Video Title
Predictions
Published
Status

The Man Behind My Motivation ,My Dad | Trade with Purab
7 months ago
•
0
•
A

The Man Behind My Motivation ,My Dad | Trade with Purab
0
7 months ago
Analyzed

Candlestick Patterns Explained | Trade with Purab
9 months ago
•
0
•
A

Candlestick Patterns Explained | Trade with Purab
0
9 months ago
Analyzed

I Fell in love with Hustle 💪🏻 | Trade with Purab #trading
11 months ago
•
0
•
A

I Fell in love with Hustle 💪🏻 | Trade with Purab #trading
0
11 months ago
Analyzed

I will Never Give Up ❌ | Trade with Purab #motivation
11 months ago
•
0
•
A

I will Never Give Up ❌ | Trade with Purab #motivation
0
11 months ago
Analyzed

Invest on Yourself - Trading Motivation | Trade with Purab #motivation
11 months ago
•
0
•
A

Invest on Yourself - Trading Motivation | Trade with Purab #motivation
0
11 months ago
Analyzed

Watch These 3 Videos & Become a Pro Trader 🔥🎥 | Trade with Purab
11 months ago
•
0
•
A

Watch These 3 Videos & Become a Pro Trader 🔥🎥 | Trade with Purab
0
11 months ago
Analyzed

Rich at Heart ❤️🐶 | Trade with Purab
11 months ago
•
0
•
A

Rich at Heart ❤️🐶 | Trade with Purab
0
11 months ago
Analyzed

Imagination to Reality 📈🏡 | Trade with Purab
11 months ago
•
0
•
A

Imagination to Reality 📈🏡 | Trade with Purab
0
11 months ago
Analyzed

Best 11 Websites that every trader should know 📈📊 | Trade with Purab
11 months ago
•
0
•
A

Best 11 Websites that every trader should know 📈📊 | Trade with Purab
0
11 months ago
Analyzed

5-10 hazar ke liye banai hui izzat nahi gawana hai mujhe ❌ | Trade with Purab
11 months ago
•
0
•
A

5-10 hazar ke liye banai hui izzat nahi gawana hai mujhe ❌ | Trade with Purab
0
11 months ago
Analyzed

Apne Maa baap ka naam Roshan karna hai ❤️ | Trade with Purab
11 months ago
•
0
•
A

Apne Maa baap ka naam Roshan karna hai ❤️ | Trade with Purab
0
11 months ago
Analyzed

90% Log Trading Me Kyu Losses Karte Hain ? 📉 | Trade with Purab
11 months ago
•
0
•
A

90% Log Trading Me Kyu Losses Karte Hain ? 📉 | Trade with Purab
0
11 months ago
Analyzed

Equity vs Options Trading – Which One is Best for You? 📈💰| Trade with Purab
11 months ago
•
0
•
A

Equity vs Options Trading – Which One is Best for You? 📈💰| Trade with Purab
0
11 months ago
Analyzed

Aaj sabhi logo ke Level se bhi uppar hu 📈 | Trade with Purab
11 months ago
•
0
•
A

Aaj sabhi logo ke Level se bhi uppar hu 📈 | Trade with Purab
0
11 months ago
Analyzed

3 Biggest Trading Mistakes That Will Wipe Out Your Money 😨❌ | Trade with Purab
11 months ago
•
0
•
A

3 Biggest Trading Mistakes That Will Wipe Out Your Money 😨❌ | Trade with Purab
0
11 months ago
Analyzed

Work hard, Shine later💡| Trade with Purab
11 months ago
•
0
•
A

Work hard, Shine later💡| Trade with Purab
0
11 months ago
Analyzed

SEBI : The Boss of Indian Stock Market 📈🔥| Trade with Purab
11 months ago
•
0
•
A

SEBI : The Boss of Indian Stock Market 📈🔥| Trade with Purab
0
11 months ago
Analyzed

4 Best Apps for Trading 🚀 | Trade with Purab
11 months ago
•
3
•
A

4 Best Apps for Trading 🚀 | Trade with Purab
3
11 months ago
Analyzed

Sabki Inspiration Banna hai 🔥 | Trade with Purab #inspiration
11 months ago
•
0
•
A

Sabki Inspiration Banna hai 🔥 | Trade with Purab #inspiration
0
11 months ago
Analyzed

4 Best Trading Indicators That Will Make You Profitable 📈💵🔥| Trade with Purab
11 months ago
•
4
•
A

4 Best Trading Indicators That Will Make You Profitable 📈💵🔥| Trade with Purab
4
11 months ago
Analyzed

No Risk, No Reward ❌💸 | Trade with Purab #motivation #shorts
11 months ago
•
0
•
A

No Risk, No Reward ❌💸 | Trade with Purab #motivation #shorts
0
11 months ago
Analyzed

100 Din Ka Trading Challenge – Are You Ready? 📈 | Trade with Purab
11 months ago
•
0
•
A

100 Din Ka Trading Challenge – Are You Ready? 📈 | Trade with Purab
0
11 months ago
Analyzed

Stock Market Se Daily ₹2000 Kaise Kamaye ? | Trade with Purab
11 months ago
•
0
•
A

Stock Market Se Daily ₹2000 Kaise Kamaye ? | Trade with Purab
0
11 months ago
Analyzed

Pichle baar se aur uppar jauga | Trade with Purab #motivation #shorts
11 months ago
•
0
•
A

Pichle baar se aur uppar jauga | Trade with Purab #motivation #shorts
0
11 months ago
Analyzed

Kya Tum Bhi Market Trends Me Faste Ho? Yeh Video Zaroor Dekho | Trade with Purab
11 months ago
•
0
•
A

Kya Tum Bhi Market Trends Me Faste Ho? Yeh Video Zaroor Dekho | Trade with Purab
0
11 months ago
Analyzed

Trading start karne ke 2 saal baad 🫠 | Trade with Purab #motivation
11 months ago
•
0
•
A

Trading start karne ke 2 saal baad 🫠 | Trade with Purab #motivation
0
11 months ago
Analyzed

Best Trading Software for Chart Analysis 📊🔥| Trade with Purab
11 months ago
•
0
•
A

Best Trading Software for Chart Analysis 📊🔥| Trade with Purab
0
11 months ago
Analyzed

How to start trading as a beginner 🚀📈 | Trade with Purab
11 months ago
•
0
•
A

How to start trading as a beginner 🚀📈 | Trade with Purab
0
11 months ago
Analyzed

Teri Ungli tujhe…. 🤡😮💨 | Trade with Purab
11 months ago
•
0
•
A

Teri Ungli tujhe…. 🤡😮💨 | Trade with Purab
0
11 months ago
Analyzed

3 best movies for Traders 🎬 📈 | Trade with Purab
11 months ago
•
0
•
A

3 best movies for Traders 🎬 📈 | Trade with Purab
0
11 months ago
Analyzed

Dream of every boy 🏠❣️ | Trade with Purab #motivation
11 months ago
•
0
•
A

Dream of every boy 🏠❣️ | Trade with Purab #motivation
0
11 months ago
Analyzed

Forex Trading Mai ek Galti aur Bank Account Freeze 😱🚫 | Trade with Purab
11 months ago
•
0
•
A

Forex Trading Mai ek Galti aur Bank Account Freeze 😱🚫 | Trade with Purab
0
11 months ago
Analyzed

Trading Shuru Karne Se Pehle Ye Zaroor Samajh Lo | Trade with Purab
11 months ago
•
0
•
A

Trading Shuru Karne Se Pehle Ye Zaroor Samajh Lo | Trade with Purab
0
11 months ago
Analyzed

Mai kitna Ameer hu ?? 💀💸 | Trade with Purab #traderlifestyle
11 months ago
•
0
•
A

Mai kitna Ameer hu ?? 💀💸 | Trade with Purab #traderlifestyle
0
11 months ago
Analyzed

Kya Trading ek addiction hai? 📊 | Trade with Purab
11 months ago
•
0
•
A

Kya Trading ek addiction hai? 📊 | Trade with Purab
0
11 months ago
Analyzed

80% Traders Satta Khelre hai? 🎲📉 | Trade with Purab
11 months ago
•
0
•
A

80% Traders Satta Khelre hai? 🎲📉 | Trade with Purab
0
11 months ago
Analyzed

Mera Trading Setup 📊 | Trade with Purab
11 months ago
•
0
•
A

Mera Trading Setup 📊 | Trade with Purab
0
11 months ago
Analyzed

Mujhe kuch nahi aata 🤡 | Trade with Purab #motivation
11 months ago
•
0
•
A

Mujhe kuch nahi aata 🤡 | Trade with Purab #motivation
0
11 months ago
Analyzed

Why Market Moves Against You? | Trade with Purab #marketanalysis
11 months ago
•
0
•
A

Why Market Moves Against You? | Trade with Purab #marketanalysis
0
11 months ago
Analyzed

Why Traders Don't Sleep ? | Trade with Purab #motivation
11 months ago
•
0
•
A

Why Traders Don't Sleep ? | Trade with Purab #motivation
0
11 months ago
Analyzed

Maine 1 Trade me kamaye 20 lakh 📊🔥| Trade with Purab
11 months ago
•
0
•
A

Maine 1 Trade me kamaye 20 lakh 📊🔥| Trade with Purab
0
11 months ago
Analyzed

Aaj tak ka Highest Profit 📈 | Trade with Purab #shorts #trading #money #profits
11 months ago
•
0
•
A

Aaj tak ka Highest Profit 📈 | Trade with Purab #shorts #trading #money #profits
0
11 months ago
Analyzed

Trading me itne Losses kyu ho rahe hai ? 😨 | Trade with Purab
11 months ago
•
1
•
A

Trading me itne Losses kyu ho rahe hai ? 😨 | Trade with Purab
1
11 months ago
Analyzed

3 Shocking Reasons why Forex is illegal 😨 | Trade with Purab
11 months ago
•
0
•
A

3 Shocking Reasons why Forex is illegal 😨 | Trade with Purab
0
11 months ago
Analyzed

Stop Chasing 100% Accuracy ! Trade Smartly | Trade with Purab
11 months ago
•
0
•
A

Stop Chasing 100% Accuracy ! Trade Smartly | Trade with Purab
0
11 months ago
Analyzed

Market mein invest karne ka best time💰🔥 | Trade with Purab
11 months ago
•
0
•
A

Market mein invest karne ka best time💰🔥 | Trade with Purab
0
11 months ago
Analyzed

Demand and supply kaise work karta hai? 📊 | Trade with Purab
11 months ago
•
0
•
A

Demand and supply kaise work karta hai? 📊 | Trade with Purab
0
11 months ago
Analyzed

The Flagship of Indian Stock Market 📊💰| Trade with Purab
11 months ago
•
0
•
A

The Flagship of Indian Stock Market 📊💰| Trade with Purab
0
11 months ago
Analyzed

Stop Chasing Losses 😨| Trade with Purab
11 months ago
•
0
•
A

Stop Chasing Losses 😨| Trade with Purab
0
11 months ago
Analyzed

Trading Indicator Se ₹8L Ek Din Ka Profit?💰| Trade with Purab
11 months ago
•
0
•
A

Trading Indicator Se ₹8L Ek Din Ka Profit?💰| Trade with Purab
0
11 months ago
Analyzed

No Foundation, No Trading Success 📊 | Trade with Purab
11 months ago
•
0
•
A

No Foundation, No Trading Success 📊 | Trade with Purab
0
11 months ago
Analyzed

Trading me ₹10k to 1 lakh 🔥🚀| Trade with Purab
11 months ago
•
3
•
A

Trading me ₹10k to 1 lakh 🔥🚀| Trade with Purab
3
11 months ago
Analyzed

Trading Par Kitna Tax ?? | Trade with Purab
11 months ago
•
0
•
A

Trading Par Kitna Tax ?? | Trade with Purab
0
11 months ago
Analyzed

Sacrifice karna padega | Trade with Purab
11 months ago
•
0
•
A

Sacrifice karna padega | Trade with Purab
0
11 months ago
Analyzed

Always be Flexible in Trading 📊| Trade with Purab
11 months ago
•
0
•
A

Always be Flexible in Trading 📊| Trade with Purab
0
11 months ago
Analyzed

The Power of Demo Account in Trading ✅ | Trading with Purab
11 months ago
•
0
•
A

The Power of Demo Account in Trading ✅ | Trading with Purab
0
11 months ago
Analyzed

Master Trading in 4 Easy Steps | Trade with Purab
11 months ago
•
0
•
A

Master Trading in 4 Easy Steps | Trade with Purab
0
11 months ago
Analyzed

Crypto Trading tumko barbad kar degi 😨 | Trade with Purab
11 months ago
•
0
•
A

Crypto Trading tumko barbad kar degi 😨 | Trade with Purab
0
11 months ago
Analyzed

Unlock Stock Market Secrets🏬📈| Trade with Purab
11 months ago
•
0
•
A

Unlock Stock Market Secrets🏬📈| Trade with Purab
0
11 months ago
Analyzed

Avoid Fake Breakouts🚀📉| Trade with Purab
11 months ago
•
0
•
A

Avoid Fake Breakouts🚀📉| Trade with Purab
0
11 months ago
Analyzed

How to choose the right trade📊| Trade with Purab
11 months ago
•
0
•
A

How to choose the right trade📊| Trade with Purab
0
11 months ago
Analyzed

Trading mai paisa Kaise banega? | Trade with Purab
11 months ago
•
0
•
A

Trading mai paisa Kaise banega? | Trade with Purab
0
11 months ago
Analyzed

Three types of stocks in the Trading market | Trade with Purab
11 months ago
•
0
•
A

Three types of stocks in the Trading market | Trade with Purab
0
11 months ago
Analyzed

Capital Required for Options Trading 📈🤯 | Trade with Purab
11 months ago
•
0
•
A

Capital Required for Options Trading 📈🤯 | Trade with Purab
0
11 months ago
Analyzed

Watch this if you Trade CRYPTO !!! 😱🤯
11 months ago
•
0
•
A

Watch this if you Trade CRYPTO !!! 😱🤯
0
11 months ago
Analyzed

Forex Trading Illegal? | Trade With Purab
11 months ago
•
0
•
A

Forex Trading Illegal? | Trade With Purab
0
11 months ago
Analyzed
Capital for Crypto Trading ? Trade with Purab
11 months ago
•
0
•
A

Capital for Crypto Trading ? Trade with Purab
0
11 months ago
Analyzed

1 minute me pura Stock Market !!?? 🤯 | Trade With Purab
11 months ago
•
3
•
A

1 minute me pura Stock Market !!?? 🤯 | Trade With Purab
3
11 months ago
Analyzed

What is Scalping in Trading? | Trade with Purab
11 months ago
•
0
•
A

What is Scalping in Trading? | Trade with Purab
0
11 months ago
Analyzed

Trading Mindset you need to make Profits 📊 | Trade with Purab
11 months ago
•
0
•
A

Trading Mindset you need to make Profits 📊 | Trade with Purab
0
11 months ago
Analyzed

Most Important Rule in Trading | Trade with Purab
11 months ago
•
0
•
A

Most Important Rule in Trading | Trade with Purab
0
11 months ago
Analyzed

Penny stocks are scam ❌ | Trade with Purab
11 months ago
•
0
•
A

Penny stocks are scam ❌ | Trade with Purab
0
11 months ago
Analyzed

Teeno Bhai Teeno Tabhai🔥| Trade with Purab
11 months ago
•
0
•
A

Teeno Bhai Teeno Tabhai🔥| Trade with Purab
0
11 months ago
Analyzed

Stock Market Mein 95% Log Barbaad Kyun Hote Hain? ❌
11 months ago
•
0
•
A

Stock Market Mein 95% Log Barbaad Kyun Hote Hain? ❌
0
11 months ago
Analyzed

These 3 Trading Videos are all you ever need !!!! 📊
11 months ago
•
0
•
A

These 3 Trading Videos are all you ever need !!!! 📊
0
11 months ago
Analyzed

20 Stocks that will make you a Crorepati in 2025
12 months ago
•
2
•
A

20 Stocks that will make you a Crorepati in 2025
2
12 months ago
Analyzed

10k to 1 Crore in Trading 😱 | Trade with Purab
12 months ago
•
0
•
A

10k to 1 Crore in Trading 😱 | Trade with Purab
0
12 months ago
Analyzed

Why is the government against Forex trading?
12 months ago
•
0
•
A

Why is the government against Forex trading?
0
12 months ago
Analyzed

Rs 5k se Trading ? 🤯😱
12 months ago
•
0
•
A

Rs 5k se Trading ? 🤯😱
0
12 months ago
Analyzed

Funded Accounts is a Scam ? 🤯 | Trade with Purab
12 months ago
•
0
•
A

Funded Accounts is a Scam ? 🤯 | Trade with Purab
0
12 months ago
Analyzed

Market Order vs Limit Order - Explained💡📈
12 months ago
•
0
•
A

Market Order vs Limit Order - Explained💡📈
0
12 months ago
Analyzed

Top 3 Must-Read Trading Books for Every Trader 📚💹
12 months ago
•
0
•
A

Top 3 Must-Read Trading Books for Every Trader 📚💹
0
12 months ago
Analyzed

Trading Par Kitna Tax ?
12 months ago
•
0
•
A

Trading Par Kitna Tax ?
0
12 months ago
Analyzed

Bhulna mat 😱
12 months ago
•
0
•
A

Bhulna mat 😱
0
12 months ago
Analyzed

Trading se paisa banana asan hai?
12 months ago
•
0
•
A

Trading se paisa banana asan hai?
0
12 months ago
Analyzed

What if I start Trading ?? 😱 | Trade with Purab #trading #shorts
12 months ago
•
0
•
A

What if I start Trading ?? 😱 | Trade with Purab #trading #shorts
0
12 months ago
Analyzed

Forex trading karne se jail ho jayegi 😨😱| Trade with Purab #trading #shorts
12 months ago
•
0
•
A

Forex trading karne se jail ho jayegi 😨😱| Trade with Purab #trading #shorts
0
12 months ago
Analyzed

Trading se kabhi ameer nhi bann paoge | Trade with Purab #shorts #trading
12 months ago
•
0
•
A

Trading se kabhi ameer nhi bann paoge | Trade with Purab #shorts #trading
0
12 months ago
Analyzed

Capital do bhai 😮💨😂 | Trade with Purab #shorts
12 months ago
•
0
•
A

Capital do bhai 😮💨😂 | Trade with Purab #shorts
0
12 months ago
Analyzed

Trading Mistake You Should NEVER Make!
12 months ago
•
0
•
A

Trading Mistake You Should NEVER Make!
0
12 months ago
Analyzed

Trading below 18 years ? 🚫 Pehle Yeh Dekhlo !
12 months ago
•
0
•
A

Trading below 18 years ? 🚫 Pehle Yeh Dekhlo !
0
12 months ago
Analyzed

1 lakh se 1 Crore in 1 month 😱🔥
12 months ago
•
0
•
A

1 lakh se 1 Crore in 1 month 😱🔥
0
12 months ago
Analyzed

1 lakh to 3 Lakhs in 1 week 😱🔥📈 | Trade with Purab #pennystocks #stockmarket
12 months ago
•
0
•
A

1 lakh to 3 Lakhs in 1 week 😱🔥📈 | Trade with Purab #pennystocks #stockmarket
0
12 months ago
Analyzed

Pakistan Stock Exchange vs Indian Stock Exchange 😂 | Trade with Purab #pakistanstockmarket #shorts
1 year ago
•
0
•
A

Pakistan Stock Exchange vs Indian Stock Exchange 😂 | Trade with Purab #pakistanstockmarket #shorts
0
1 year ago
Analyzed

Mujhse bohot badi Galti ho gayi | Trade with Purab #trading #tradingmentor
1 year ago
•
0
•
A

Mujhse bohot badi Galti ho gayi | Trade with Purab #trading #tradingmentor
0
1 year ago
Analyzed

Ye Trading mistake aap kabhi mat karna | Trade with Purab #tradingmistakes #trading
1 year ago
•
0
•
A

Ye Trading mistake aap kabhi mat karna | Trade with Purab #tradingmistakes #trading
0
1 year ago
Analyzed

Pakistan Stock Exchange 😂 | Trade with Purab #nse #pakistanstockexchange
1 year ago
•
0
•
A

Pakistan Stock Exchange 😂 | Trade with Purab #nse #pakistanstockexchange
0
1 year ago
Analyzed

How & Where to do Paper Trading 🤑😱 | Trade with Purab #papertrading #daytrading
1 year ago
•
0
•
A

How & Where to do Paper Trading 🤑😱 | Trade with Purab #papertrading #daytrading
0
1 year ago
Analyzed

Itna paisa sirf inke liye 🤡 | Trade with Purab #tradingmemes #shorts
1 year ago
•
0
•
A

Itna paisa sirf inke liye 🤡 | Trade with Purab #tradingmemes #shorts
0
1 year ago
Analyzed

Yaar ye India ka Market 😭😭 | Trade with Purab #stockmarket #shorts
1 year ago
•
0
•
A

Yaar ye India ka Market 😭😭 | Trade with Purab #stockmarket #shorts
0
1 year ago
Analyzed

Best Trading Advice 🔥🙏 | Trade with Purab #tradingadvice #trading
1 year ago
•
0
•
A

Best Trading Advice 🔥🙏 | Trade with Purab #tradingadvice #trading
0
1 year ago
Analyzed

Mera baap kyu dega paise ❌ | Trade with Purab #tradingcapital #money
1 year ago
•
0
•
A

Mera baap kyu dega paise ❌ | Trade with Purab #tradingcapital #money
0
1 year ago
Analyzed

Mustang in India 😭🤯 | Trade with Purab #demandandsupply #trading
1 year ago
•
1
•
A

Mustang in India 😭🤯 | Trade with Purab #demandandsupply #trading
1
1 year ago
Analyzed

Trading Gareebo ke liye nahi hai ❌😭 | Trade with Purab #tradingforbeginers #tradingreality
1 year ago
•
0
•
A

Trading Gareebo ke liye nahi hai ❌😭 | Trade with Purab #tradingforbeginers #tradingreality
0
1 year ago
Analyzed

1 Crore from Trading ! 😱🤯| Trade with Purab #tradingprofit #money
1 year ago
•
0
•
A

1 Crore from Trading ! 😱🤯| Trade with Purab #tradingprofit #money
0
1 year ago
Analyzed

Trading to Gambling hai 🤡 | Trade with Purab #trading #shorts
1 year ago
•
0
•
A

Trading to Gambling hai 🤡 | Trade with Purab #trading #shorts
0
1 year ago
Analyzed

Me in Trading vs School | Trade with Purab #trending #shorts #trader
1 year ago
•
0
•
A

Me in Trading vs School | Trade with Purab #trending #shorts #trader
0
1 year ago
Analyzed

Porsche at 21 Years Old 🔥 | Trade with Purab #porsche #shorts
1 year ago
•
0
•
A

Porsche at 21 Years Old 🔥 | Trade with Purab #porsche #shorts
0
1 year ago
Analyzed

Middle Class Log 😮💨📈 | Trade with Purab #motivation #trader
1 year ago
•
0
•
A

Middle Class Log 😮💨📈 | Trade with Purab #motivation #trader
0
1 year ago
Analyzed

How to make Profits from Trading - Step by step Guide | Trade with Purab
1 year ago
•
0
•
A

How to make Profits from Trading - Step by step Guide | Trade with Purab
0
1 year ago
Analyzed

Timeframe for Intraday Trading | Trade with Purab #intradaytrading #shorts
1 year ago
•
1
•
A

Timeframe for Intraday Trading | Trade with Purab #intradaytrading #shorts
1
1 year ago
Analyzed

How much Capital for Equity Trading | Trade with Purab #equitytrading #tradingtips
1 year ago
•
1
•
A

How much Capital for Equity Trading | Trade with Purab #equitytrading #tradingtips
1
1 year ago
Analyzed

Trading tumhe Barbad kar sakti hai ❌ | Trade with Purab #tradingincome #daytrading
1 year ago
•
0
•
A

Trading tumhe Barbad kar sakti hai ❌ | Trade with Purab #tradingincome #daytrading
0
1 year ago
Analyzed

Traders 😭😭😭 | Trade with Purab #tradingmemes #shorts
1 year ago
•
0
•
A

Traders 😭😭😭 | Trade with Purab #tradingmemes #shorts
0
1 year ago
Analyzed

Trading aapki zindagi badal sakti hai 💸📊 | Trade with Purab #trading #tradinglifestyle
1 year ago
•
0
•
A

Trading aapki zindagi badal sakti hai 💸📊 | Trade with Purab #trading #tradinglifestyle
0
1 year ago
Analyzed

Roadmap for Trading | Trade with Purab #tradingforbeginners #tradingtips
1 year ago
•
0
•
A

Roadmap for Trading | Trade with Purab #tradingforbeginners #tradingtips
0
1 year ago
Analyzed

How to Start Trading from Scratch 🤑📈 | Trade with Purab #trading #tradingforex
1 year ago
•
0
•
A

How to Start Trading from Scratch 🤑📈 | Trade with Purab #trading #tradingforex
0
1 year ago
Analyzed

Don’t Start Trading Without Watching This | Trade with Purab #beginnerstrading #trading
1 year ago
•
0
•
A

Don’t Start Trading Without Watching This | Trade with Purab #beginnerstrading #trading
0
1 year ago
Analyzed

Me in School vs Trading | Trade with Purab #trading #shorts
1 year ago
•
0
•
A

Me in School vs Trading | Trade with Purab #trading #shorts
0
1 year ago
Analyzed

Top 3 Trading Books - Every Trader must read | Trade with Purab #tradingbook #shorts
1 year ago
•
0
•
A

Top 3 Trading Books - Every Trader must read | Trade with Purab #tradingbook #shorts
0
1 year ago
Analyzed

King of Trading Industry | Trade with Purab #trader #millionaire
1 year ago
•
0
•
A

King of Trading Industry | Trade with Purab #trader #millionaire
0
1 year ago
Analyzed

How to Start Trading in 2025 🔥📈 | Trade with Purab #trading #shorts
1 year ago
•
0
•
A

How to Start Trading in 2025 🔥📈 | Trade with Purab #trading #shorts
0
1 year ago
Analyzed

Top Youtube Channels to Learn Trading | Trade with Purab #trading #tradingchannels
1 year ago
•
0
•
A

Top Youtube Channels to Learn Trading | Trade with Purab #trading #tradingchannels
0
1 year ago
Analyzed

Story of a Trading Millionaire | Trade with Purab #motivation #successstory #shorts
1 year ago
•
0
•
A

Story of a Trading Millionaire | Trade with Purab #motivation #successstory #shorts
0
1 year ago
Analyzed

Best Trading Strategy 📈🔥 | Trade with Purab #tradingstrategy #shorts
1 year ago
•
0
•
A

Best Trading Strategy 📈🔥 | Trade with Purab #tradingstrategy #shorts
0
1 year ago
Analyzed

Highest Profit in 1 Trade ?? | Trade with Purab #tradingprofit #trader
1 year ago
•
0
•
A

Highest Profit in 1 Trade ?? | Trade with Purab #tradingprofit #trader
0
1 year ago
Analyzed

How Forex Brokers Make Money 🤑💸 | Trade with Purab #spread #forextrading
1 year ago
•
0
•
A

How Forex Brokers Make Money 🤑💸 | Trade with Purab #spread #forextrading
0
1 year ago
Analyzed

Stock Market under 1 Minute | Trade with Purab #stockmarket #shorts
1 year ago
•
0
•
A
Stock Market under 1 Minute | Trade with Purab #stockmarket #shorts
0
1 year ago
Analyzed

Right Time to Invest | Trade with Purab #stockmarket #trading
1 year ago
•
0
•
A

Right Time to Invest | Trade with Purab #stockmarket #trading
0
1 year ago
Analyzed

How to Start Trading in 2025 | Trade with Purab #investing #trading
1 year ago
•
0
•
A

How to Start Trading in 2025 | Trade with Purab #investing #trading
0
1 year ago
Analyzed

Traders - India Chod do 🇮🇳 | Trade with Purab #daytrader #traderlife #shortsvideo
1 year ago
•
0
•
A

Traders - India Chod do 🇮🇳 | Trade with Purab #daytrader #traderlife #shortsvideo
0
1 year ago
Analyzed

Trading = Driving Porsche | Trade with Purab #tradingexperience #trading
1 year ago
•
0
•
A

Trading = Driving Porsche | Trade with Purab #tradingexperience #trading
0
1 year ago
Analyzed

Forex Pairs Explained | Trade with Purab #currencypairs #forextrading #forex
1 year ago
•
0
•
A

Forex Pairs Explained | Trade with Purab #currencypairs #forextrading #forex
0
1 year ago
Analyzed

What if I try Trading in 2025
1 year ago
•
4
•
A

What if I try Trading in 2025
4
1 year ago
Analyzed

Stock Market Crash 😱😭 How to Trade | Trade with Purab #stockmarket #marketcrash
1 year ago
•
0
•
A

Stock Market Crash 😱😭 How to Trade | Trade with Purab #stockmarket #marketcrash
0
1 year ago
Analyzed

SMC vs Price Action vs ICT Trading | Trade with Purab #smc #priceaction #ict
1 year ago
•
0
•
A

SMC vs Price Action vs ICT Trading | Trade with Purab #smc #priceaction #ict
0
1 year ago
Analyzed

Leverage in Forex Trading Explained | Trade with Purab #forextrading #leverage
1 year ago
•
0
•
A

Leverage in Forex Trading Explained | Trade with Purab #forextrading #leverage
0
1 year ago
Analyzed

IPO Explained | Trade with Purab #ipo #shorts
1 year ago
•
0
•
A

IPO Explained | Trade with Purab #ipo #shorts
0
1 year ago
Analyzed

Trading me Experience Zaruri hai | Trade with Purab #trading #tradingtips
1 year ago
•
0
•
A

Trading me Experience Zaruri hai | Trade with Purab #trading #tradingtips
0
1 year ago
Analyzed

Lot sizes in Forex Trading | Trade with Purab #lotsize #forextrading
1 year ago
•
0
•
A

Lot sizes in Forex Trading | Trade with Purab #lotsize #forextrading
0
1 year ago
Analyzed

Stock Market Crash hone wala hai | Trade with Purab #stockmarket #stockmarketcrash
1 year ago
•
0
•
A

Stock Market Crash hone wala hai | Trade with Purab #stockmarket #stockmarketcrash
0
1 year ago
Analyzed

Trading se Crores ka Profit 🤑💸📈| Trade with Purab #trader #shorts
1 year ago
•
0
•
A

Trading se Crores ka Profit 🤑💸📈| Trade with Purab #trader #shorts
0
1 year ago
Analyzed

Trading ke sabse important points | Trade with Purab #trading #tradingstrategy
1 year ago
•
0
•
A

Trading ke sabse important points | Trade with Purab #trading #tradingstrategy
0
1 year ago
Analyzed

Stop Trading Options ❌📉 | Trade with Purab #optionstrading #daytrading
1 year ago
•
0
•
A

Stop Trading Options ❌📉 | Trade with Purab #optionstrading #daytrading
0
1 year ago
Analyzed

Best Youtube Channels to Learn Trading FREE 📈🔥🤑 | Trade with Purab #stockmarket #stocktrading
1 year ago
•
0
•
A

Best Youtube Channels to Learn Trading FREE 📈🔥🤑 | Trade with Purab #stockmarket #stocktrading
0
1 year ago
Analyzed

Do not Trade in Stock Market ❌ | Trade with Purab #stockmarket #shorts
1 year ago
•
0
•
A
Do not Trade in Stock Market ❌ | Trade with Purab #stockmarket #shorts
0
1 year ago
Analyzed

My Trading Story / My Success Story | Trade with Purab #tradingjourney #shorts
1 year ago
•
0
•
A

My Trading Story / My Success Story | Trade with Purab #tradingjourney #shorts
0
1 year ago
Analyzed

Lots explained in Forex Trading | Trade with Purab #forex #trading #shorts
1 year ago
•
0
•
A

Lots explained in Forex Trading | Trade with Purab #forex #trading #shorts
0
1 year ago
Analyzed

Steps to become a Trader | Trade with Purab #trader #trading
1 year ago
•
0
•
A

Steps to become a Trader | Trade with Purab #trader #trading
0
1 year ago
Analyzed

Paise jala diye 😭📉 | Trade with Purab #trading #shortsvideo
1 year ago
•
0
•
A

Paise jala diye 😭📉 | Trade with Purab #trading #shortsvideo
0
1 year ago
Analyzed

ICT & SMC traders 😂🤣 | Trade with Purab
1 year ago
•
0
•
A

ICT & SMC traders 😂🤣 | Trade with Purab
0
1 year ago
Analyzed

Share prices upar ya niche Q jate hai | Trade with Purab #shares #stockmarket
1 year ago
•
0
•
A

Share prices upar ya niche Q jate hai | Trade with Purab #shares #stockmarket
0
1 year ago
Analyzed

Legal ways to Trade Forex without getting Arrested | Trade with Purab #forextrading #trading
1 year ago
•
0
•
A

Legal ways to Trade Forex without getting Arrested | Trade with Purab #forextrading #trading
0
1 year ago
Analyzed

Do not Trade in December | Trade with Purab #trading #tradingmarket
1 year ago
•
1
•
A

Do not Trade in December | Trade with Purab #trading #tradingmarket
1
1 year ago
Analyzed

Forex Trading is illegal in India 🇮🇳 | Trade with Purab #forextrading #trading
1 year ago
•
0
•
A

Forex Trading is illegal in India 🇮🇳 | Trade with Purab #forextrading #trading
0
1 year ago
Analyzed

Forex Trading Explained under 90 Seconds | Trade with Purab #forextrading #shorts
1 year ago
•
0
•
A

Forex Trading Explained under 90 Seconds | Trade with Purab #forextrading #shorts
0
1 year ago
Analyzed

Forex Trading in 10 Days | Trade with Purab #forextrading #tradingseries
1 year ago
•
0
•
A

Forex Trading in 10 Days | Trade with Purab #forextrading #tradingseries
0
1 year ago
Analyzed

Trading Bike chalane jaisa hai | Trade with Purab #tradingtips #shorts
1 year ago
•
0
•
A

Trading Bike chalane jaisa hai | Trade with Purab #tradingtips #shorts
0
1 year ago
Analyzed
Trading se Paisa nahi kama sakte | Trade with Purab #trading #shorts
1 year ago
•
0
•
A

Trading se Paisa nahi kama sakte | Trade with Purab #trading #shorts
0
1 year ago
Analyzed

Forex Traders Arrested | Trade with Purab #forextrader #forextrading #shorts
1 year ago
•
0
•
A

Forex Traders Arrested | Trade with Purab #forextrader #forextrading #shorts
0
1 year ago
Analyzed

Stock Market se Paise kaise kamate hai !? | Trade with Purab #stockmarket #earnmoneyonline #shorts
1 year ago
•
0
•
A

Stock Market se Paise kaise kamate hai !? | Trade with Purab #stockmarket #earnmoneyonline #shorts
0
1 year ago
Analyzed

Trading Tips for Beginners 🥶😮💨 | Trade with Purab #trader #trading #shortsvideo
1 year ago
•
0
•
A

Trading Tips for Beginners 🥶😮💨 | Trade with Purab #trader #trading #shortsvideo
0
1 year ago
Analyzed

Stock ne Aura minus kar diya | Trading memes | Trade with Purab #stocktrading #shorts #funnyshorts
1 year ago
•
0
•
A

Stock ne Aura minus kar diya | Trading memes | Trade with Purab #stocktrading #shorts #funnyshorts
0
1 year ago
Analyzed

Trading portfolio ka colour | Trade with Purab #trading #trendingshorts
1 year ago
•
0
•
A

Trading portfolio ka colour | Trade with Purab #trading #trendingshorts
0
1 year ago
Analyzed

How to Learn Trading for Free | Trade with Purab #freetradingtips #trading #shorts
1 year ago
•
0
•
A

How to Learn Trading for Free | Trade with Purab #freetradingtips #trading #shorts
0
1 year ago
Analyzed

Trading changed my story | Trade with Purab #trader #motivation
1 year ago
•
0
•
A

Trading changed my story | Trade with Purab #trader #motivation
0
1 year ago
Analyzed

Steps to become Successful Trader | Trade with Purab #trading #daytrading
1 year ago
•
0
•
A
Steps to become Successful Trader | Trade with Purab #trading #daytrading
0
1 year ago
Analyzed

Do not start Trading without Watching this ❌ | Trade with Purab #trading #shorts
1 year ago
•
0
•
A

Do not start Trading without Watching this ❌ | Trade with Purab #trading #shorts
0
1 year ago
Analyzed

Best ₹1 Penny Stocks | Trade with Purab #pennystocks #trading
1 year ago
•
0
•
A

Best ₹1 Penny Stocks | Trade with Purab #pennystocks #trading
0
1 year ago
Analyzed

All important Candlestick Patterns | Single Candle Patterns
1 year ago
•
0
•
A

All important Candlestick Patterns | Single Candle Patterns
0
1 year ago
Analyzed

30 lessons, 1 success | Trade with Purab #motivation #trader #shorts
1 year ago
•
0
•
A

30 lessons, 1 success | Trade with Purab #motivation #trader #shorts
0
1 year ago
Analyzed

When Support become Resistance in Trading | Trade with Purab #trading #shorts
1 year ago
•
0
•
A

When Support become Resistance in Trading | Trade with Purab #trading #shorts
0
1 year ago
Analyzed

Invest Smart for the Long-Term | Trade with Purab #educationalvideo #shorts
1 year ago
•
0
•
A

Invest Smart for the Long-Term | Trade with Purab #educationalvideo #shorts
0
1 year ago
Analyzed
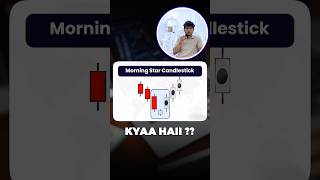
Morning Star Candlestick Pattern| Trade with Purab #educationalvideo #shorts
1 year ago
•
0
•
A

Morning Star Candlestick Pattern| Trade with Purab #educationalvideo #shorts
0
1 year ago
Analyzed

Trading ki Sabse Badi Galti ! | Trade with Purab
1 year ago
•
0
•
A

Trading ki Sabse Badi Galti ! | Trade with Purab
0
1 year ago
Analyzed

How Social Media Triggers Panic in the Stock Market | Trade with Purab
1 year ago
•
0
•
A

How Social Media Triggers Panic in the Stock Market | Trade with Purab
0
1 year ago
Analyzed

Traders course kyu bechte hai | Trade with Purab #tradingcourse #daytrading
1 year ago
•
0
•
A

Traders course kyu bechte hai | Trade with Purab #tradingcourse #daytrading
0
1 year ago
Analyzed

Do not Trade in the Stock Market | Trade with Purab #trading #shorts
1 year ago
•
0
•
A

Do not Trade in the Stock Market | Trade with Purab #trading #shorts
0
1 year ago
Analyzed

Market sikhne ke liye apna time do | Trade with Purab #stockmarket #shorts
1 year ago
•
0
•
A

Market sikhne ke liye apna time do | Trade with Purab #stockmarket #shorts
0
1 year ago
Analyzed

is Trading worth it ?? | Trade with Purab #motivationalvideo #shorts
1 year ago
•
0
•
A

is Trading worth it ?? | Trade with Purab #motivationalvideo #shorts
0
1 year ago
Analyzed

The most Difficult thing in Trading | Trade with Purab #trading #shorts
1 year ago
•
0
•
A

The most Difficult thing in Trading | Trade with Purab #trading #shorts
0
1 year ago
Analyzed

Trading from Scratch| Trade with Purab #educationalvideo #shorts
1 year ago
•
1
•
A
Trading from Scratch| Trade with Purab #educationalvideo #shorts
1
1 year ago
Analyzed

Trading me profitable kaise bane ? | Trade with Purab #trading #shorts
1 year ago
•
0
•
A

Trading me profitable kaise bane ? | Trade with Purab #trading #shorts
0
1 year ago
Analyzed

₹10k to 10 Crores | Trade with Purab #sharemarket #stockmarket #shorts
1 year ago
•
1
•
A

₹10k to 10 Crores | Trade with Purab #sharemarket #stockmarket #shorts
1
1 year ago
Analyzed

Trading Jua hai !!!! toh fir UPSC ka kya ?? | Trade with Purab #trading #shorts
1 year ago
•
0
•
A

Trading Jua hai !!!! toh fir UPSC ka kya ?? | Trade with Purab #trading #shorts
0
1 year ago
Analyzed

Can you Start Trading with ₹1000 ? | Trade with Purab #starttrading #trading
1 year ago
•
0
•
A

Can you Start Trading with ₹1000 ? | Trade with Purab #starttrading #trading
0
1 year ago
Analyzed

Ek din zaroor - Trading Motivation #shorts
1 year ago
•
0
•
A

Ek din zaroor - Trading Motivation #shorts
0
1 year ago
Analyzed

Trading is Easy 🥹| Trade with Purab | #tradingmemes #memes
1 year ago
•
0
•
A

Trading is Easy 🥹| Trade with Purab | #tradingmemes #memes
0
1 year ago
Analyzed

How To Calculate Bank Nifty Profits |Trade with purab #educationalvideo
1 year ago
•
0
•
A

How To Calculate Bank Nifty Profits |Trade with purab #educationalvideo
0
1 year ago
Analyzed
Trading start from low capital 💹 | Trade with purab #educationalvideo
1 year ago
•
0
•
A

Trading start from low capital 💹 | Trade with purab #educationalvideo
0
1 year ago
Analyzed

Which Trading Type is Best for Beginners! | Trade with Purab #educational
1 year ago
•
0
•
A

Which Trading Type is Best for Beginners! | Trade with Purab #educational
0
1 year ago
Analyzed

How to Select Best Stocks for Trading - Trade with Purab #stocks
1 year ago
•
0
•
A

How to Select Best Stocks for Trading - Trade with Purab #stocks
0
1 year ago
Analyzed

Trading Roadmap for Beginners | Trading with Purab - #shorts
1 year ago
•
0
•
A

Trading Roadmap for Beginners | Trading with Purab - #shorts
0
1 year ago
Analyzed

Best Trading Strategy 😂📊|Trade with Purab #tradingmemes
1 year ago
•
0
•
A

Best Trading Strategy 😂📊|Trade with Purab #tradingmemes
0
1 year ago
Analyzed

Trading is tough but ..!! Trade with Purab
1 year ago
•
0
•
A

Trading is tough but ..!! Trade with Purab
0
1 year ago
Analyzed

Learn Trading for FREE - Stock Market | Trade with Purab #stockmarket #stocktrading
1 year ago
•
0
•
A

Learn Trading for FREE - Stock Market | Trade with Purab #stockmarket #stocktrading
0
1 year ago
Analyzed

Intraday trading VS long- term investment 📊| Trade with Purab #tradingvideo
1 year ago
•
0
•
A

Intraday trading VS long- term investment 📊| Trade with Purab #tradingvideo
0
1 year ago
Analyzed

Road dikhi, Khod diya !!! Trade with Purab #tradingmemes
1 year ago
•
0
•
A

Road dikhi, Khod diya !!! Trade with Purab #tradingmemes
0
1 year ago
Analyzed

Can you Start Trading with ₹20 | #educationalvideo
1 year ago
•
0
•
A

Can you Start Trading with ₹20 | #educationalvideo
0
1 year ago
Analyzed

FD vs Mutual Funds vs Trading | Trade with Purab #educationalvideo
1 year ago
•
3
•
A

FD vs Mutual Funds vs Trading | Trade with Purab #educationalvideo
3
1 year ago
Analyzed

When She is A Trader 💹 | Trading Memes | Trade with Purab #funny
1 year ago
•
0
•
A

When She is A Trader 💹 | Trading Memes | Trade with Purab #funny
0
1 year ago
Analyzed

3 Best Trading Tips for Beginners with Roadmap | Trade with Purab
1 year ago
•
0
•
A

3 Best Trading Tips for Beginners with Roadmap | Trade with Purab
0
1 year ago
Analyzed

Trading mat kar, sab doob jayega !! | Trade with Purab #trading
1 year ago
•
0
•
A

Trading mat kar, sab doob jayega !! | Trade with Purab #trading
0
1 year ago
Analyzed

Trading ka Hero 🦹 Trade with Purab #tradingmemes #animalmovie
1 year ago
•
0
•
A

Trading ka Hero 🦹 Trade with Purab #tradingmemes #animalmovie
0
1 year ago
Analyzed

Ek Trade me Paisa Double 😎💸 | Trade with Purab #tradingmemes
1 year ago
•
0
•
A

Ek Trade me Paisa Double 😎💸 | Trade with Purab #tradingmemes
0
1 year ago
Analyzed

Support & Resistance Explained - Trading for Beginners | Trade with Purab #trading
1 year ago
•
0
•
A

Support & Resistance Explained - Trading for Beginners | Trade with Purab #trading
0
1 year ago
Analyzed

STOP! Don’t Invest in Stocks Until You Watch This! | Trade with Purab
1 year ago
•
0
•
A

STOP! Don’t Invest in Stocks Until You Watch This! | Trade with Purab
0
1 year ago
Analyzed

Ek Din Profit Double Hoga ! 💰🚀 | Trading Memes | Trade with Purab
1 year ago
•
3
•
A

Ek Din Profit Double Hoga ! 💰🚀 | Trading Memes | Trade with Purab
3
1 year ago
Analyzed

10 Crores per Month from Trading !! | Trade with purab | #education
1 year ago
•
0
•
A

10 Crores per Month from Trading !! | Trade with purab | #education
0
1 year ago
Analyzed

Naukri Chahiye kisko 😂 | Trading Memes | Trade with Purab #funnyvideo
1 year ago
•
0
•
A

Naukri Chahiye kisko 😂 | Trading Memes | Trade with Purab #funnyvideo
0
1 year ago
Analyzed

Top 3 Channels to Learn Trading for FREE | Trade with Purab
1 year ago
•
0
•
A

Top 3 Channels to Learn Trading for FREE | Trade with Purab
0
1 year ago
Analyzed

Story of Every Trader | Trading Memes | Trade with Purab #memes #trading
1 year ago
•
0
•
A

Story of Every Trader | Trading Memes | Trade with Purab #memes #trading
0
1 year ago
Analyzed

What is Partial Booking in Trading ? | Trade with Purab #stockmarket
1 year ago
•
1
•
A

What is Partial Booking in Trading ? | Trade with Purab #stockmarket
1
1 year ago
Analyzed

All Trading Chart Patterns | Trade with Purab #trading #chartpatterns
1 year ago
•
0
•
A

All Trading Chart Patterns | Trade with Purab #trading #chartpatterns
0
1 year ago
Analyzed

Was Trading Worth it !!?? | Trade with Purab | Motivational video
1 year ago
•
0
•
A

Was Trading Worth it !!?? | Trade with Purab | Motivational video
0
1 year ago
Analyzed

Options Trading = Gambling | Trade with Purab
1 year ago
•
0
•
A

Options Trading = Gambling | Trade with Purab
0
1 year ago
Analyzed

Indian Stock Market Vs US Stock Market | Trade with Purab |
1 year ago
•
0
•
A

Indian Stock Market Vs US Stock Market | Trade with Purab |
0
1 year ago
Analyzed

Is the Stock Market Just a Scam? 💸| Trade with Purab |#stockmarket #tradingtips
1 year ago
•
0
•
A

Is the Stock Market Just a Scam? 💸| Trade with Purab |#stockmarket #tradingtips
0
1 year ago
Analyzed

Will Gold reach ₹1 Lakh ? | Trade with Purab | #goldrate
1 year ago
•
1
•
A

Will Gold reach ₹1 Lakh ? | Trade with Purab | #goldrate
1
1 year ago
Analyzed

Life is like Trading | Trade with Purab
1 year ago
•
0
•
A

Life is like Trading | Trade with Purab
0
1 year ago
Analyzed

Aao tum bhi lelo maza 😂 - Trading Memes | Trade with Purab
1 year ago
•
0
•
A

Aao tum bhi lelo maza 😂 - Trading Memes | Trade with Purab
0
1 year ago
Analyzed

Stock Market Explained in One Minute | Trade with Purab #stockmarket #sharemarket
1 year ago
•
0
•
A

Stock Market Explained in One Minute | Trade with Purab #stockmarket #sharemarket
0
1 year ago
Analyzed

Start trading From Scratch | Trading For Beginners | Trade with Purab
1 year ago
•
0
•
A

Start trading From Scratch | Trading For Beginners | Trade with Purab
0
1 year ago
Analyzed

Options Trading karne ke baad 💀😂 | Funny Memes | Trade with Purab #shorts #trading
1 year ago
•
0
•
A

Options Trading karne ke baad 💀😂 | Funny Memes | Trade with Purab #shorts #trading
0
1 year ago
Analyzed

How to Start Trading Step by Step | Trade with Purab #tradingforbeginners #trading
1 year ago
•
0
•
A

How to Start Trading Step by Step | Trade with Purab #tradingforbeginners #trading
0
1 year ago
Analyzed

Har jagah share market ki tips dedeta hu 😂💀|Trade with Purab Memes
1 year ago
•
0
•
A

Har jagah share market ki tips dedeta hu 😂💀|Trade with Purab Memes
0
1 year ago
Analyzed

Before & After Stock Market | Trade with Purab | Trading Memes
1 year ago
•
0
•
A

Before & After Stock Market | Trade with Purab | Trading Memes
0
1 year ago
Analyzed

Best Penny Stock under 5 Rupees | Multibagger stock #stocks #pennystocks
1 year ago
•
0
•
A

Best Penny Stock under 5 Rupees | Multibagger stock #stocks #pennystocks
0
1 year ago
Analyzed

Jab papa apka portfolio check kare | Trade with Purab #sharemarket #shorts
1 year ago
•
0
•
A

Jab papa apka portfolio check kare | Trade with Purab #sharemarket #shorts
0
1 year ago
Analyzed

Trading ka Vardaan | Trade with Purab Memes
1 year ago
•
0
•
A

Trading ka Vardaan | Trade with Purab Memes
0
1 year ago
Analyzed

Options Chain Explained | How to use Options Chain | Trade with Purab #optionchain #trading
1 year ago
•
2
•
A

Options Chain Explained | How to use Options Chain | Trade with Purab #optionchain #trading
2
1 year ago
Analyzed

1 Crore Vs 10 Lakhs every year - Trade with Purab
1 year ago
•
0
•
A

1 Crore Vs 10 Lakhs every year - Trade with Purab
0
1 year ago
Analyzed

Profits in Trading - Trading memes | Trade with Purab
1 year ago
•
0
•
A
Profits in Trading - Trading memes | Trade with Purab
0
1 year ago
Analyzed

HDFC old shares | Trade with Purab #tradingfunny #shorts
1 year ago
•
2
•
A

HDFC old shares | Trade with Purab #tradingfunny #shorts
2
1 year ago
Analyzed

Truth about trading | Trade with Purab #trading #inspiration
1 year ago
•
0
•
A

Truth about trading | Trade with Purab #trading #inspiration
0
1 year ago
Analyzed

Trading ka Jadoo 💀😂 | Trading Meme | Trade with Purab #funnymeme #tradingmemes #shorts
1 year ago
•
0
•
A

Trading ka Jadoo 💀😂 | Trading Meme | Trade with Purab #funnymeme #tradingmemes #shorts
0
1 year ago
Analyzed

Trader Vs Market - Trading Memes | Stock Market memes
1 year ago
•
0
•
A

Trader Vs Market - Trading Memes | Stock Market memes
0
1 year ago
Analyzed

Candlesticks Explained - Part 2 | Trade with Purab #candlestick #daytrading
1 year ago
•
0
•
A

Candlesticks Explained - Part 2 | Trade with Purab #candlestick #daytrading
0
1 year ago
Analyzed

Candlesticks Explained | Trade with Purab #candlestick #trading
1 year ago
•
0
•
A

Candlesticks Explained | Trade with Purab #candlestick #trading
0
1 year ago
Analyzed

Trader vs Pyaz Lasun Bank 🤣 | Trade with Purab
1 year ago
•
0
•
A

Trader vs Pyaz Lasun Bank 🤣 | Trade with Purab
0
1 year ago
Analyzed

Options Trading Explained under 1 Minute | Call Options - Trade with Purab
1 year ago
•
0
•
A

Options Trading Explained under 1 Minute | Call Options - Trade with Purab
0
1 year ago
Analyzed

Stock Market Explained - Pt 2 | Trade with Purab #stocktrading #trading
1 year ago
•
0
•
A

Stock Market Explained - Pt 2 | Trade with Purab #stocktrading #trading
0
1 year ago
Analyzed

Pura Stock Market in 1 Minute | Trade with Purab #stockmarket #stocks
1 year ago
•
0
•
A

Pura Stock Market in 1 Minute | Trade with Purab #stockmarket #stocks
0
1 year ago
Analyzed

Trader Dost 😂
1 year ago
•
0
•
A

Trader Dost 😂
0
1 year ago
Analyzed

Best Trading Books for Trading | Trading Tips | Trade with Purab | #tradingshorts
1 year ago
•
0
•
A

Best Trading Books for Trading | Trading Tips | Trade with Purab | #tradingshorts
0
1 year ago
Analyzed

Types of Trading | Trade with Purab #equity #trading #shorts
1 year ago
•
0
•
A

Types of Trading | Trade with Purab #equity #trading #shorts
0
1 year ago
Analyzed

Trading with 10k Capital | Day Trading | Trade with Purab #tradingstrategy #shorts
1 year ago
•
0
•
A

Trading with 10k Capital | Day Trading | Trade with Purab #tradingstrategy #shorts
0
1 year ago
Analyzed

Fastest way to Make Money in trading - Intraday Trading | Trade with Purab #intradaytrading #shorts
1 year ago
•
0
•
A

Fastest way to Make Money in trading - Intraday Trading | Trade with Purab #intradaytrading #shorts
0
1 year ago
Analyzed

Dost jo mujhe trading chodhne keh raha hai | Trade with Purab #funnymemes #shorts
1 year ago
•
0
•
A

Dost jo mujhe trading chodhne keh raha hai | Trade with Purab #funnymemes #shorts
0
1 year ago
Analyzed

What are ETF’s ? ETF explained - Trade with Purab #etf #stockmarket #trading
1 year ago
•
2
•
A

What are ETF’s ? ETF explained - Trade with Purab #etf #stockmarket #trading
2
1 year ago
Analyzed

Support & Resistance Crash Course - Everything you need | Trade with Purab
1 year ago
•
10
•
A

Support & Resistance Crash Course - Everything you need | Trade with Purab
10
1 year ago
Analyzed

My Trading income Revealed | Trade with Purab 😭😂
1 year ago
•
0
•
A

My Trading income Revealed | Trade with Purab 😭😂
0
1 year ago
Analyzed

Problem of a Trader | Middle Class Trader Problems
1 year ago
•
0
•
A

Problem of a Trader | Middle Class Trader Problems
0
1 year ago
Analyzed

Trader ko ghar se nikal diya !😭
1 year ago
•
0
•
A

Trader ko ghar se nikal diya !😭
0
1 year ago
Analyzed

Me when I see my Trades😂😭
1 year ago
•
0
•
A

Me when I see my Trades😂😭
0
1 year ago
Analyzed
All Candlestick Patterns in 1 hour | Trade with Purab
1 year ago
•
19
•
A

All Candlestick Patterns in 1 hour | Trade with Purab
19
1 year ago
Analyzed

Best Timeframe for Trading | Intraday, Fno, Swing - Trade with Purab
1 year ago
•
0
•
A
Best Timeframe for Trading | Intraday, Fno, Swing - Trade with Purab
0
1 year ago
Analyzed

Before Vs After Trading | Power of Trading 🔥💸🤑
1 year ago
•
0
•
A

Before Vs After Trading | Power of Trading 🔥💸🤑
0
1 year ago
Analyzed

Stock Market explained in 1 minute !! | Trade with Purab #stockmarket #trading
1 year ago
•
0
•
A

Stock Market explained in 1 minute !! | Trade with Purab #stockmarket #trading
0
1 year ago
Analyzed

What is Engulfing Candle | Trade with Purab #shorts #engulfingpattern
1 year ago
•
0
•
A

What is Engulfing Candle | Trade with Purab #shorts #engulfingpattern
0
1 year ago
Analyzed

Trading energizes me, studies drain me, business drives me | Trade with Purab #shorts #forextrader
1 year ago
•
0
•
A

Trading energizes me, studies drain me, business drives me | Trade with Purab #shorts #forextrader
0
1 year ago
Analyzed

Forex Trading vs Stock Market | Which is better ? Trade with Purab
1 year ago
•
10
•
A

Forex Trading vs Stock Market | Which is better ? Trade with Purab
10
1 year ago
Analyzed

Trading ko Juaa kaise bol diya | Trade with Purab #trading #shorts
1 year ago
•
0
•
A

Trading ko Juaa kaise bol diya | Trade with Purab #trading #shorts
0
1 year ago
Analyzed

Trading ke liye paise chahiye | Trade with Purab #shorts #tradingmemes
1 year ago
•
0
•
A

Trading ke liye paise chahiye | Trade with Purab #shorts #tradingmemes
0
1 year ago
Analyzed

Best Chart Patterns for Trading | Most Popular Reversal Patterns
1 year ago
•
1
•
A

Best Chart Patterns for Trading | Most Popular Reversal Patterns
1
1 year ago
Analyzed

Why Beginners Should Start with Smaller Trades | Trade with Purab #beginnertrading
1 year ago
•
0
•
A

Why Beginners Should Start with Smaller Trades | Trade with Purab #beginnertrading
0
1 year ago
Analyzed

How make 5k rupees daily with Trading | Trade with Purab #dailyprofit #trading #shorts
1 year ago
•
0
•
A

How make 5k rupees daily with Trading | Trade with Purab #dailyprofit #trading #shorts
0
1 year ago
Analyzed

How much capital need to start trading | Trade with Purab #tradingcapital #shorts
1 year ago
•
2
•
A

How much capital need to start trading | Trade with Purab #tradingcapital #shorts
2
1 year ago
Analyzed

Trading is easy ?? | Trade with Purab #trading #shorts
1 year ago
•
0
•
A

Trading is easy ?? | Trade with Purab #trading #shorts
0
1 year ago
Analyzed

Friend jo hamesha loss karwata hai | Trade with Purab #tradingmemes #funny
1 year ago
•
0
•
A

Friend jo hamesha loss karwata hai | Trade with Purab #tradingmemes #funny
0
1 year ago
Analyzed

Option Trading karke garib ban gaya 😂💀| Trade with Purab #shorts #funnyshorts
1 year ago
•
0
•
A

Option Trading karke garib ban gaya 😂💀| Trade with Purab #shorts #funnyshorts
0
1 year ago
Analyzed

Trading tips for Beginners | Trade with Purab #tradingtips #shortsvideo
1 year ago
•
0
•
A

Trading tips for Beginners | Trade with Purab #tradingtips #shortsvideo
0
1 year ago
Analyzed

Types of Trading | Trade with Purab #shorts #trading
1 year ago
•
0
•
A

Types of Trading | Trade with Purab #shorts #trading
0
1 year ago
Analyzed

Trading is Everything | Trade with Purab #trading #shorts
1 year ago
•
0
•
A

Trading is Everything | Trade with Purab #trading #shorts
0
1 year ago
Analyzed

4 Rules for Intraday Trading | Trade with Purab
1 year ago
•
0
•
A

4 Rules for Intraday Trading | Trade with Purab
0
1 year ago
Analyzed

Trading is Easy !?? Trade with Purab #stockmarket #shorts
1 year ago
•
0
•
A

Trading is Easy !?? Trade with Purab #stockmarket #shorts
0
1 year ago
Analyzed

Trading is all about Practice & Experiences | Trade with Purab | #tradingtips #tradingguide
1 year ago
•
0
•
A

Trading is all about Practice & Experiences | Trade with Purab | #tradingtips #tradingguide
0
1 year ago
Analyzed

Tricks to learn Candlestick Patterns | Learn Chart Patterns | Trade with Purab
1 year ago
•
1
•
A

Tricks to learn Candlestick Patterns | Learn Chart Patterns | Trade with Purab
1
1 year ago
Analyzed

Mummy Papa ka naam Roshan karke dikhaya | Trade with Purab #motivation #success
1 year ago
•
0
•
A
Mummy Papa ka naam Roshan karke dikhaya | Trade with Purab #motivation #success
0
1 year ago
Analyzed

What is a Doji Candlestick? | Trade with Purab #trading #dojicandle
1 year ago
•
0
•
A

What is a Doji Candlestick? | Trade with Purab #trading #dojicandle
0
1 year ago
Analyzed

Master All Candlestick Patterns in 60 Seconds | Trade with Purab | #tradingtips #tradingshorts
1 year ago
•
0
•
A

Master All Candlestick Patterns in 60 Seconds | Trade with Purab | #tradingtips #tradingshorts
0
1 year ago
Analyzed

My Biggest Mistakes in Trading😭😱 | Trade with Purab #tradingtips #stockmarket
1 year ago
•
0
•
A

My Biggest Mistakes in Trading😭😱 | Trade with Purab #tradingtips #stockmarket
0
1 year ago
Analyzed

What is leverage in Forex Trading | Trade with Purab @acetradingofficial
1 year ago
•
14
•
A

What is leverage in Forex Trading | Trade with Purab @acetradingofficial
14
1 year ago
Analyzed

How to Handle Stress in Trading ! 😭 | Trade with Purab #tradingmarket #stockmarket
1 year ago
•
0
•
A

How to Handle Stress in Trading ! 😭 | Trade with Purab #tradingmarket #stockmarket
0
1 year ago
Analyzed

Power of Trading - Before Vs After Trading | #transformation
1 year ago
•
0
•
A

Power of Trading - Before Vs After Trading | #transformation
0
1 year ago
Analyzed

Understanding Currency Pairs & Co-relation in Forex Trading | Trade with Purab
1 year ago
•
3
•
A

Understanding Currency Pairs & Co-relation in Forex Trading | Trade with Purab
3
1 year ago
Analyzed

Why do Traders suffer Losses | Trade with Purab #tradingloss #shorts
1 year ago
•
0
•
A

Why do Traders suffer Losses | Trade with Purab #tradingloss #shorts
0
1 year ago
Analyzed

What are Pips in Forex Trading | Trade with Purab #forextrading #pips
1 year ago
•
0
•
A

What are Pips in Forex Trading | Trade with Purab #forextrading #pips
0
1 year ago
Analyzed

Trading Jua haii ?? | Trade with Purab #trading #shorts
1 year ago
•
0
•
A

Trading Jua haii ?? | Trade with Purab #trading #shorts
0
1 year ago
Analyzed

Lot sizes in Forex Trading - Micro lot, Mini lot, Standard lot
1 year ago
•
0
•
A

Lot sizes in Forex Trading - Micro lot, Mini lot, Standard lot
0
1 year ago
Analyzed

Maa ka bharosa nahi toda | Trade with Purab #shorts #mom #motivation
1 year ago
•
0
•
A

Maa ka bharosa nahi toda | Trade with Purab #shorts #mom #motivation
0
1 year ago
Analyzed

Chances of being a Profitable Trader | Trade with Purab #profitable #shorts
1 year ago
•
0
•
A

Chances of being a Profitable Trader | Trade with Purab #profitable #shorts
0
1 year ago
Analyzed

How to Trade Forex - LEGALLY | Trade with Purab @acetradingofficial
1 year ago
•
10
•
A

How to Trade Forex - LEGALLY | Trade with Purab @acetradingofficial
10
1 year ago
Analyzed

Meri maa ko mujhpar bharosa hai | Trade with Purab #proudmom #shorts
1 year ago
•
0
•
A

Meri maa ko mujhpar bharosa hai | Trade with Purab #proudmom #shorts
0
1 year ago
Analyzed

What is Leverage in Forex Trading | Trade with Purab #forextrading #leveragetrading
1 year ago
•
0
•
A

What is Leverage in Forex Trading | Trade with Purab #forextrading #leveragetrading
0
1 year ago
Analyzed

Best Trading Strategy 💀 | Trade with Purab #tradingmemes #shorts
1 year ago
•
2
•
A

Best Trading Strategy 💀 | Trade with Purab #tradingmemes #shorts
2
1 year ago
Analyzed

Is Forex Trading Legal in India | Trade with Purab @acetradingofficial
1 year ago
•
24
•
A

Is Forex Trading Legal in India | Trade with Purab @acetradingofficial
24
1 year ago
Analyzed

How to trade forex legally in India | Trade with Purab #trading #shorts
1 year ago
•
0
•
A

How to trade forex legally in India | Trade with Purab #trading #shorts
0
1 year ago
Analyzed

Trading is Hard - Trading Motivation | Trade with Purab
1 year ago
•
0
•
A

Trading is Hard - Trading Motivation | Trade with Purab
0
1 year ago
Analyzed

HOW TO START TRADING AS A BEGINNER - Free Guide
1 year ago
•
20
•
A

HOW TO START TRADING AS A BEGINNER - Free Guide
20
1 year ago
Analyzed

How Much Money Do You Need to Start Trading | Trade with Purab #tradingcapital #shorts
1 year ago
•
0
•
A

How Much Money Do You Need to Start Trading | Trade with Purab #tradingcapital #shorts
0
1 year ago
Analyzed

Forex Trading illegal in India - Exposed | Trade with Purab #forextrading #trading #shorts
1 year ago
•
0
•
A

Forex Trading illegal in India - Exposed | Trade with Purab #forextrading #trading #shorts
0
1 year ago
Analyzed

ULTIMATE PRICE ACTION COURSE 🔥 - 3 Hours Non-stop 📈 | Trade with Purab
1 year ago
•
29
•
A

ULTIMATE PRICE ACTION COURSE 🔥 - 3 Hours Non-stop 📈 | Trade with Purab
29
1 year ago
Analyzed

2 types of traders | Trade with purab #shorts #trader
1 year ago
•
0
•
A

2 types of traders | Trade with purab #shorts #trader
0
1 year ago
Analyzed

Day One Vs One Day - Trading Motivation
1 year ago
•
0
•
A

Day One Vs One Day - Trading Motivation
0
1 year ago
Analyzed

What is Forex Trading | Trade with Purab #forex #trading #shorts
1 year ago
•
0
•
A

What is Forex Trading | Trade with Purab #forex #trading #shorts
0
1 year ago
Analyzed

Shares Split kya hota hai ? Share Split explained | Trade with Purab
1 year ago
•
0
•
A

Shares Split kya hota hai ? Share Split explained | Trade with Purab
0
1 year ago
Analyzed

Intraday Vs Options Vs Swing Trading | Which one is best ?
1 year ago
•
12
•
A

Intraday Vs Options Vs Swing Trading | Which one is best ?
12
1 year ago
Analyzed

Learn Forex Trading | Trade with Purab #forextrading #freetradingcourse #youtubeshorts
1 year ago
•
0
•
A

Learn Forex Trading | Trade with Purab #forextrading #freetradingcourse #youtubeshorts
0
1 year ago
Analyzed

Intraday Market Analysis & Best Timeframe - Pt-2 Free Intraday Trading Course
1 year ago
•
5
•
A

Intraday Market Analysis & Best Timeframe - Pt-2 Free Intraday Trading Course
5
1 year ago
Analyzed

Once a joke, now the inspiration | Trade with Purab #shorts #traderlife
1 year ago
•
0
•
A

Once a joke, now the inspiration | Trade with Purab #shorts #traderlife
0
1 year ago
Analyzed

1 lakh ka Loss | Trade with Purab #shorts #funnyshorts
1 year ago
•
0
•
A

1 lakh ka Loss | Trade with Purab #shorts #funnyshorts
0
1 year ago
Analyzed

Best Timeframe for Trading - Intraday, Options, Swing, BTST | Trade with Purab
1 year ago
•
33
•
A

Best Timeframe for Trading - Intraday, Options, Swing, BTST | Trade with Purab
33
1 year ago
Analyzed

When you have Option Trader friend in your group | Trade with Purab #tradingmemes #shorts
1 year ago
•
0
•
A

When you have Option Trader friend in your group | Trade with Purab #tradingmemes #shorts
0
1 year ago
Analyzed

Teacher Vs Trader 📈😁| Trade with Purab #tradingmemes #motivation #trader
1 year ago
•
0
•
A

Teacher Vs Trader 📈😁| Trade with Purab #tradingmemes #motivation #trader
0
1 year ago
Analyzed

Retail traders ke paise kon khaega 🤣| Trade with Purab #tradingmemes #shorts
1 year ago
•
0
•
A

Retail traders ke paise kon khaega 🤣| Trade with Purab #tradingmemes #shorts
0
1 year ago
Analyzed

Successful trader Journey | Trade with Purab #trading #shorts #motivation
1 year ago
•
0
•
A

Successful trader Journey | Trade with Purab #trading #shorts #motivation
0
1 year ago
Analyzed

Best Way to Draw Trendlines & SnR levels | Trade with Purab
1 year ago
•
9
•
A

Best Way to Draw Trendlines & SnR levels | Trade with Purab
9
1 year ago
Analyzed

Trading easy hai 🤯😂 | Trade with Purab #tradingmemes #funny #shorts
1 year ago
•
0
•
A

Trading easy hai 🤯😂 | Trade with Purab #tradingmemes #funny #shorts
0
1 year ago
Analyzed

Life of a Trader | Trade with Purab #forextrader #shorts #trading
1 year ago
•
0
•
A

Life of a Trader | Trade with Purab #forextrader #shorts #trading
0
1 year ago
Analyzed

Trading Nowadays | Trade with Purab #tradingmemes #funnyvideo
1 year ago
•
0
•
A

Trading Nowadays | Trade with Purab #tradingmemes #funnyvideo
0
1 year ago
Analyzed

Meri trade chal rahi thi 😭 | Trading memes | Trade with Purab #funnyvideo #shorts
1 year ago
•
0
•
A

Meri trade chal rahi thi 😭 | Trading memes | Trade with Purab #funnyvideo #shorts
0
1 year ago
Analyzed

Apni Jeet se Unko Galat Sabit Karo | Trade with Purab #trading #shorts
1 year ago
•
0
•
A

Apni Jeet se Unko Galat Sabit Karo | Trade with Purab #trading #shorts
0
1 year ago
Analyzed
Intraday Trading Full Course - FREE | L-01 - Trade With Purab
1 year ago
•
117
•
A

Intraday Trading Full Course - FREE | L-01 - Trade With Purab
117
1 year ago
Analyzed

500 ke loss me ro rahi thi 💀 | Trading Meme | Trade with Purab #funnyvideo #daytrader
1 year ago
•
0
•
A

500 ke loss me ro rahi thi 💀 | Trading Meme | Trade with Purab #funnyvideo #daytrader
0
1 year ago
Analyzed

No Loss Trading Strategy | Trading meme | Trade with Purab #shorts #funnyvideo
1 year ago
•
0
•
A

No Loss Trading Strategy | Trading meme | Trade with Purab #shorts #funnyvideo
0
1 year ago
Analyzed

Trader on social media vs in real life | Trade with Purab #trader #shorts
1 year ago
•
0
•
A

Trader on social media vs in real life | Trade with Purab #trader #shorts
0
1 year ago
Analyzed

Aankh khulte hi Profit Gayab | Trade with Purab #trading #shorts
1 year ago
•
0
•
A

Aankh khulte hi Profit Gayab | Trade with Purab #trading #shorts
0
1 year ago
Analyzed

Trading se Paise nahi bante😳| The Truth about Trading | Trade with Purab #trading #shorts
1 year ago
•
0
•
A

Trading se Paise nahi bante😳| The Truth about Trading | Trade with Purab #trading #shorts
0
1 year ago
Analyzed

College dropout becomes a successful trader | Trade with Purab #forextrader #tradermotivation
1 year ago
•
0
•
A

College dropout becomes a successful trader | Trade with Purab #forextrader #tradermotivation
0
1 year ago
Analyzed

Girls Vs Boys after losing money in trading 😂💀 | Trade with Purab #tradingmemes #shorts
1 year ago
•
0
•
A

Girls Vs Boys after losing money in trading 😂💀 | Trade with Purab #tradingmemes #shorts
0
1 year ago
Analyzed

Trading ne waqt badal diya😂 (just for fun) | Trade with Purab #tradingmemes #shorts
1 year ago
•
0
•
A

Trading ne waqt badal diya😂 (just for fun) | Trade with Purab #tradingmemes #shorts
0
1 year ago
Analyzed

What is Option Chain? | L-4 Options Trading Course | Trading with Purab
1 year ago
•
10
•
A
What is Option Chain? | L-4 Options Trading Course | Trading with Purab
10
1 year ago
Analyzed

ek Nakamiyab Trader ki Journey - Vardaan by Carryminati | Trade with Purab #trading #shorts
1 year ago
•
0
•
A

ek Nakamiyab Trader ki Journey - Vardaan by Carryminati | Trade with Purab #trading #shorts
0
1 year ago
Analyzed

From Auto to Porsche - Before Vs After Trading | Kaise hua | Trade with Purab #beforeandafter
1 year ago
•
0
•
A

From Auto to Porsche - Before Vs After Trading | Kaise hua | Trade with Purab #beforeandafter
0
1 year ago
Analyzed

Har din naye kapde pehnuga | Trade with Purab #motivational #shorts
1 year ago
•
0
•
A

Har din naye kapde pehnuga | Trade with Purab #motivational #shorts
0
1 year ago
Analyzed

Trading is very easy | Trade with Purab #funnyvideo #tradingmemes #shorts
1 year ago
•
0
•
A

Trading is very easy | Trade with Purab #funnyvideo #tradingmemes #shorts
0
1 year ago
Analyzed
Options Buying Vs Selling - L3 | Free Options Trading Course
1 year ago
•
15
•
A

Options Buying Vs Selling - L3 | Free Options Trading Course
15
1 year ago
Analyzed

Story of Every Trader 😭| Trade with Purab #tradingloss #emotioncontrol #shorts
1 year ago
•
0
•
A

Story of Every Trader 😭| Trade with Purab #tradingloss #emotioncontrol #shorts
0
1 year ago
Analyzed

Trading = Gambling?? 😡😱 | Trade with Purab #traderlifestyle #youtubeshorts
1 year ago
•
0
•
A

Trading = Gambling?? 😡😱 | Trade with Purab #traderlifestyle #youtubeshorts
0
1 year ago
Analyzed

Before trading 💀 After trading🤡 | Trade with Purab | #tradingloss #tradingmemes #shorts
1 year ago
•
0
•
A

Before trading 💀 After trading🤡 | Trade with Purab | #tradingloss #tradingmemes #shorts
0
1 year ago
Analyzed

Power of Trading - BMW😍🔥 | Trade with Purab #trading #traderlifestyle #shorts
1 year ago
•
0
•
A

Power of Trading - BMW😍🔥 | Trade with Purab #trading #traderlifestyle #shorts
0
1 year ago
Analyzed

Indian Parents Vs Trading 💀😭| Trade with Purab #tradingmemes #shortvideo
1 year ago
•
0
•
A

Indian Parents Vs Trading 💀😭| Trade with Purab #tradingmemes #shortvideo
0
1 year ago
Analyzed

Trading Transformation - Before & After 📈 | Trade with Purab #motivation #shortsfeed
1 year ago
•
0
•
A

Trading Transformation - Before & After 📈 | Trade with Purab #motivation #shortsfeed
0
1 year ago
Analyzed

I’m Gay 🤫❌ | Trade with Purab #trader #youtubeshorts
1 year ago
•
0
•
A

I’m Gay 🤫❌ | Trade with Purab #trader #youtubeshorts
0
1 year ago
Analyzed

FnO Traders 😂💀 | Trade with Purab #tradingmemes #funnyvideo #tradermemes
1 year ago
•
0
•
A

FnO Traders 😂💀 | Trade with Purab #tradingmemes #funnyvideo #tradermemes
0
1 year ago
Analyzed

3 Years Trading Transformation 😱🔥| Trade with Purab #shortsviral #forextrader
1 year ago
•
0
•
A

3 Years Trading Transformation 😱🔥| Trade with Purab #shortsviral #forextrader
0
1 year ago
Analyzed

Trader vs Engineer 🤣💀 | Trade with Purab #trading #engineering #shorts
1 year ago
•
0
•
A

Trader vs Engineer 🤣💀 | Trade with Purab #trading #engineering #shorts
0
1 year ago
Analyzed

Paise Ginna🤩 - Fav hobby😂 | Trade with Purab #trading #money #shortsvideo
1 year ago
•
0
•
A

Paise Ginna🤩 - Fav hobby😂 | Trade with Purab #trading #money #shortsvideo
0
1 year ago
Analyzed

You’re not Ugly, You’re just Poor | Trade with Purab #trader #shorts
1 year ago
•
0
•
A

You’re not Ugly, You’re just Poor | Trade with Purab #trader #shorts
0
1 year ago
Analyzed

Every Trader’s Story😍 - Men will be Men | Trade with Purab #shorts #trading
1 year ago
•
0
•
A

Every Trader’s Story😍 - Men will be Men | Trade with Purab #shorts #trading
0
1 year ago
Analyzed

1 Lakh se 1 Crore with Trading😱😱😱 | Trade with Purab
1 year ago
•
0
•
A

1 Lakh se 1 Crore with Trading😱😱😱 | Trade with Purab
0
1 year ago
Analyzed

Trading me Paisa Double | Trade with Purab #forextrading #stockmarket #shorts
1 year ago
•
0
•
A

Trading me Paisa Double | Trade with Purab #forextrading #stockmarket #shorts
0
1 year ago
Analyzed

Before vs After Trading - Ek kahani 🚀
1 year ago
•
0
•
A

Before vs After Trading - Ek kahani 🚀
0
1 year ago
Analyzed

When she lost 500₹ in Trading | Trade with Purab #tradingmemes #youtubeshorts
1 year ago
•
0
•
A

When she lost 500₹ in Trading | Trade with Purab #tradingmemes #youtubeshorts
0
1 year ago
Analyzed

Asked Mom for money for Trading | Trade with Purab #trading #shorts
1 year ago
•
0
•
A

Asked Mom for money for Trading | Trade with Purab #trading #shorts
0
1 year ago
Analyzed

When she compares you with a Govt. Employee | Trade with Purab #traderlifestyle #motivation
1 year ago
•
0
•
A

When she compares you with a Govt. Employee | Trade with Purab #traderlifestyle #motivation
0
1 year ago
Analyzed

When I ask Money for Trading | Trade with Purab #tradingmemes #youtubeshorts
1 year ago
•
0
•
A

When I ask Money for Trading | Trade with Purab #tradingmemes #youtubeshorts
0
1 year ago
Analyzed

Taking my dahej straight to the trading floor | Trade with Purab #trading #investment
1 year ago
•
0
•
A

Taking my dahej straight to the trading floor | Trade with Purab #trading #investment
0
1 year ago
Analyzed

Trading Looking at Breakout - Trading Memes
1 year ago
•
25
•
A

Trading Looking at Breakout - Trading Memes
25
1 year ago
Analyzed

Papa ko mere loss ke bare me pata chal gaya 😭 | Trade with Purab #funnyvideo #youtubeshorts
1 year ago
•
0
•
A

Papa ko mere loss ke bare me pata chal gaya 😭 | Trade with Purab #funnyvideo #youtubeshorts
0
1 year ago
Analyzed

Gym trainer becomes Millionaire Trader | Trade with Purab #journey #motivation #youtubeshorts
1 year ago
•
0
•
A

Gym trainer becomes Millionaire Trader | Trade with Purab #journey #motivation #youtubeshorts
0
1 year ago
Analyzed

From where I started and now where I am | Trade with Purab #tradingmemes #trader #youtubeshorts
1 year ago
•
0
•
A

From where I started and now where I am | Trade with Purab #tradingmemes #trader #youtubeshorts
0
1 year ago
Analyzed

Rise from their doubt and shine through your success | Trade with Purab #success #trader #shorts
1 year ago
•
0
•
A

Rise from their doubt and shine through your success | Trade with Purab #success #trader #shorts
0
1 year ago
Analyzed
Ek trade me Capital Uda diya 😤🤯 | Trade with Purab #shorts #trader #youtubeshorts
1 year ago
•
0
•
A

Ek trade me Capital Uda diya 😤🤯 | Trade with Purab #shorts #trader #youtubeshorts
0
1 year ago
Analyzed

Time changes Everything | Trade with Purab #youtubeshorts #journey #shortsviral
1 year ago
•
0
•
A

Time changes Everything | Trade with Purab #youtubeshorts #journey #shortsviral
0
1 year ago
Analyzed

Once they see your success, they’ll wonder how you did it | Trade with Purab
1 year ago
•
0
•
A

Once they see your success, they’ll wonder how you did it | Trade with Purab
0
1 year ago
Analyzed

When she says phle Verified PnL Dikhao fir shadi karege | Trade with Purab #funny #trading #shorts
1 year ago
•
0
•
A

When she says phle Verified PnL Dikhao fir shadi karege | Trade with Purab #funny #trading #shorts
0
1 year ago
Analyzed

Options Traders ka dard wahi samaj sakte hai | Trading with Purab #optionstrading #shorts
1 year ago
•
0
•
A

Options Traders ka dard wahi samaj sakte hai | Trading with Purab #optionstrading #shorts
0
1 year ago
Analyzed

Every Equity Holder’s Problem | Trade with Purab #hindenburg #shorts
1 year ago
•
0
•
A

Every Equity Holder’s Problem | Trade with Purab #hindenburg #shorts
0
1 year ago
Analyzed

Ek Trade me Loss recover | Trade with purab #shorts
1 year ago
•
0
•
A

Ek Trade me Loss recover | Trade with purab #shorts
0
1 year ago
Analyzed

Their negativity fuels your determination | Trade with Purab | #trading #traderlife
1 year ago
•
0
•
A

Their negativity fuels your determination | Trade with Purab | #trading #traderlife
0
1 year ago
Analyzed

Addicted to the thrill of option trading | Trade with Purab
1 year ago
•
0
•
A

Addicted to the thrill of option trading | Trade with Purab
0
1 year ago
Analyzed

Chart Patterns Crash Course | Important Patterns Pt-2
1 year ago
•
7
•
A

Chart Patterns Crash Course | Important Patterns Pt-2
7
1 year ago
Analyzed

Trading loss led to a brotherly slap | Trade with Purab #trading #funny
1 year ago
•
0
•
A

Trading loss led to a brotherly slap | Trade with Purab #trading #funny
0
1 year ago
Analyzed

Distracted by trading tips, not another miss | Trade with Purab
1 year ago
•
0
•
A

Distracted by trading tips, not another miss | Trade with Purab
0
1 year ago
Analyzed

From losses to profits, determination makes the difference | Trade with Purab #trading #shorts
1 year ago
•
0
•
A

From losses to profits, determination makes the difference | Trade with Purab #trading #shorts
0
1 year ago
Analyzed

Fibonacci Crash Course for Beginners | Fibonacci Retracement Tool
1 year ago
•
58
•
A

Fibonacci Crash Course for Beginners | Fibonacci Retracement Tool
58
1 year ago
Analyzed

From trading to building a multi-business future | Trade with Purab #trading #business #shorts
1 year ago
•
0
•
A

From trading to building a multi-business future | Trade with Purab #trading #business #shorts
0
1 year ago
Analyzed

All Chart Patterns Free Course | Learn Trading for Free
1 year ago
•
54
•
A

All Chart Patterns Free Course | Learn Trading for Free
54
1 year ago
Analyzed

My trader friend Vs My condition | Trade with Purab #trading #shorts
1 year ago
•
0
•
A

My trader friend Vs My condition | Trade with Purab #trading #shorts
0
1 year ago
Analyzed

Demo Trading Vs Real Trading | Trade with Purab #trading #shorts
1 year ago
•
0
•
A

Demo Trading Vs Real Trading | Trade with Purab #trading #shorts
0
1 year ago
Analyzed

Candlestick Trading Full Course | Candlesticks Free Masterclass #candlestickpattern #trading
1 year ago
•
10
•
A

Candlestick Trading Full Course | Candlesticks Free Masterclass #candlestickpattern #trading
10
1 year ago
Analyzed

Trader Vs Market | Trading with Purab #stockmarket #trading #trader #funny
1 year ago
•
0
•
A

Trader Vs Market | Trading with Purab #stockmarket #trading #trader #funny
0
1 year ago
Analyzed

Trading taught me that patience is the key to success | Trade with Purab #trading #daytrader #short
1 year ago
•
0
•
A

Trading taught me that patience is the key to success | Trade with Purab #trading #daytrader #short
0
1 year ago
Analyzed

Importance of Stop loss in trading | Trade with Purab #trading #daytrading #shorts
1 year ago
•
0
•
A

Importance of Stop loss in trading | Trade with Purab #trading #daytrading #shorts
0
1 year ago
Analyzed

Every Trader Story | Trading Meme | Trade with Purab #daytrading #trading #shorts
1 year ago
•
0
•
A

Every Trader Story | Trading Meme | Trade with Purab #daytrading #trading #shorts
0
1 year ago
Analyzed

OPTION GREEKS EXPLAINED | Lec 02 - OPTIONS TRADING COURSE
1 year ago
•
14
•
A

OPTION GREEKS EXPLAINED | Lec 02 - OPTIONS TRADING COURSE
14
1 year ago
Analyzed

Trader dost ko Paise udhaar diye | Funny Meme | Trade with Purab #tradingmemes #shorts
1 year ago
•
0
•
A

Trader dost ko Paise udhaar diye | Funny Meme | Trade with Purab #tradingmemes #shorts
0
1 year ago
Analyzed

Options Trading Course | Free Trading Course - Lecture 1
1 year ago
•
6
•
A

Options Trading Course | Free Trading Course - Lecture 1
6
1 year ago
Analyzed

Trader and Investors after Budget Day | Trade with Purab #budget2024 #traders #investor #funny
1 year ago
•
0
•
A

Trader and Investors after Budget Day | Trade with Purab #budget2024 #traders #investor #funny
0
1 year ago
Analyzed

When Trader trying to predict the market | Trade with Purab #funny #trading #shorts
1 year ago
•
0
•
A

When Trader trying to predict the market | Trade with Purab #funny #trading #shorts
0
1 year ago
Analyzed

Don't trade with borrowed money | Trade with Purab #beginnertrader #tradingtips #shorts
1 year ago
•
0
•
A

Don't trade with borrowed money | Trade with Purab #beginnertrader #tradingtips #shorts
0
1 year ago
Analyzed

Why is Indian government steadily raising trading taxes? | Trade with Purab #futureandoptiontrading
1 year ago
•
0
•
A

Why is Indian government steadily raising trading taxes? | Trade with Purab #futureandoptiontrading
0
1 year ago
Analyzed

Rise above and stay unstoppable | Trade with Purab #motivation #shorts
1 year ago
•
0
•
A

Rise above and stay unstoppable | Trade with Purab #motivation #shorts
0
1 year ago
Analyzed

Ek trade me profit double | Funny Meme | Trade with Purab. #trading #comedy #shorts
1 year ago
•
0
•
A

Ek trade me profit double | Funny Meme | Trade with Purab. #trading #comedy #shorts
0
1 year ago
Analyzed

The things happened after I started Trading | Trade with Purab #tradingjourney #struggle #shorts
1 year ago
•
0
•
A

The things happened after I started Trading | Trade with Purab #tradingjourney #struggle #shorts
0
1 year ago
Analyzed

WazirX Hacked | Biggest Cryptocurrency Exchange Hack in India | Trade with Purab #crypto #wazirx
1 year ago
•
4
•
A

WazirX Hacked | Biggest Cryptocurrency Exchange Hack in India | Trade with Purab #crypto #wazirx
4
1 year ago
Analyzed

When your biggest flex is your Parent's Pride | Purab Darda #momdad #parents #shorts
1 year ago
•
0
•
A

When your biggest flex is your Parent's Pride | Purab Darda #momdad #parents #shorts
0
1 year ago
Analyzed

How an Experienced Trader manages his Trades | Trade with Purab #trading #tradingpsychology #shorts
1 year ago
•
0
•
A

How an Experienced Trader manages his Trades | Trade with Purab #trading #tradingpsychology #shorts
0
1 year ago
Analyzed

Trading mistakes to avoid | Trading with purab #trading #tradingstrategy #shorts
1 year ago
•
0
•
A

Trading mistakes to avoid | Trading with purab #trading #tradingstrategy #shorts
0
1 year ago
Analyzed

Is Trading Safe for 16-17 Year old? | Trade with Purab
1 year ago
•
1
•
A

Is Trading Safe for 16-17 Year old? | Trade with Purab
1
1 year ago
Analyzed

I was removed from school - Trade with Purab
1 year ago
•
0
•
A

I was removed from school - Trade with Purab
0
1 year ago
Analyzed

Discipline in Trading - Trade with Purab
1 year ago
•
0
•
A

Discipline in Trading - Trade with Purab
0
1 year ago
Analyzed

Future vs Options Trading - Learn Trading in 30 Days Ep-7 | Trade with Purab
1 year ago
•
0
•
A

Future vs Options Trading - Learn Trading in 30 Days Ep-7 | Trade with Purab
0
1 year ago
Analyzed

Price action Trading Strategy - Learn Trading in 30 Days Ep-5 | Trade with Purab
1 year ago
•
0
•
A

Price action Trading Strategy - Learn Trading in 30 Days Ep-5 | Trade with Purab
0
1 year ago
Analyzed

Different forms of Trading Styles - Learn Trading in 30 Days Ep-3 | Trade with Purab
1 year ago
•
0
•
A

Different forms of Trading Styles - Learn Trading in 30 Days Ep-3 | Trade with Purab
0
1 year ago
Analyzed

Different form of Trading - Learn Trading in 30 Days Ep-2 | Trade with Purab
1 year ago
•
0
•
A

Different form of Trading - Learn Trading in 30 Days Ep-2 | Trade with Purab
0
1 year ago
Analyzed

What is Trading ? - Learn Trading in 30 Days Ep-1 | Trade with Purab
1 year ago
•
0
•
A

What is Trading ? - Learn Trading in 30 Days Ep-1 | Trade with Purab
0
1 year ago
Analyzed

What is Options Trading ? | Trade with Purab #tradingshorts
1 year ago
•
0
•
A

What is Options Trading ? | Trade with Purab #tradingshorts
0
1 year ago
Analyzed

What is Options Trading ? | Options Trading for Beginners - Trade with Purab
1 year ago
•
0
•
A

What is Options Trading ? | Options Trading for Beginners - Trade with Purab
0
1 year ago
Analyzed

Why Crypto Currency is illegal in India? | Trade with Purab
1 year ago
•
0
•
A

Why Crypto Currency is illegal in India? | Trade with Purab
0
1 year ago
Analyzed

Crypto banned in India? | Trade with Purab
1 year ago
•
0
•
A

Crypto banned in India? | Trade with Purab
0
1 year ago
Analyzed

Future of Crypto in India | Trade with Purab
1 year ago
•
5
•
A

Future of Crypto in India | Trade with Purab
5
1 year ago
Analyzed

Government & Crypto - The real truth | Trade with Purab
1 year ago
•
0
•
A

Government & Crypto - The real truth | Trade with Purab
0
1 year ago
Analyzed

Start taking risk in Trading | Trade with Purab | #shorts #podcast
1 year ago
•
0
•
A

Start taking risk in Trading | Trade with Purab | #shorts #podcast
0
1 year ago
Analyzed
What is Forex Trading For Beginners | Forex Trading Explained | Trade with Purab
1 year ago
•
5
•
A

What is Forex Trading For Beginners | Forex Trading Explained | Trade with Purab
5
1 year ago
Analyzed

Smart traders know when to stop | Trade with Purab | #shorts #podcast
1 year ago
•
0
•
A

Smart traders know when to stop | Trade with Purab | #shorts #podcast
0
1 year ago
Analyzed

Trading Podcast on Radio - @MirchiPlusYT | Trading Tips & Story - Trade with Purab
1 year ago
•
8
•
A

Trading Podcast on Radio - @MirchiPlusYT | Trading Tips & Story - Trade with Purab
8
1 year ago
Analyzed

My Journey : The ups, the downs, and everything in between | Trade with Purab | #shorts #ytshorts
1 year ago
•
0
•
A

My Journey : The ups, the downs, and everything in between | Trade with Purab | #shorts #ytshorts
0
1 year ago
Analyzed

Why I Started Trading | How i Became a Successful Trader - Trade with Purab
1 year ago
•
3
•
A

Why I Started Trading | How i Became a Successful Trader - Trade with Purab
3
1 year ago
Analyzed

Mustang ka hua Accident- #shortsvlog
1 year ago
•
0
•
A

Mustang ka hua Accident- #shortsvlog
0
1 year ago
Analyzed

My Success Story - TRADING JOURNEY | Trade With Purab
1 year ago
•
1
•
A

My Success Story - TRADING JOURNEY | Trade With Purab
1
1 year ago
Analyzed

Porsche Delivery Short Vlog | Trade with Purab #shortsvlog #dailyvlogs #vloggerlife
1 year ago
•
0
•
A

Porsche Delivery Short Vlog | Trade with Purab #shortsvlog #dailyvlogs #vloggerlife
0
1 year ago
Analyzed

Porsche Delivery | Every Boy Dream- #shortsvideo #shorts
1 year ago
•
0
•
A

Porsche Delivery | Every Boy Dream- #shortsvideo #shorts
0
1 year ago
Analyzed

Traders after making profit | Shorts #trading #profit
2 years ago
•
0
•
A

Traders after making profit | Shorts #trading #profit
0
2 years ago
Analyzed

Dream Car Delivery - Mustang GT
2 years ago
•
5
•
A

Dream Car Delivery - Mustang GT
5
2 years ago
Analyzed

Why I tell people not to start trading?
2 years ago
•
0
•
A

Why I tell people not to start trading?
0
2 years ago
Analyzed

Trading during Covid was just..!!! #trading #shorts #ytshorts
2 years ago
•
0
•
A

Trading during Covid was just..!!! #trading #shorts #ytshorts
0
2 years ago
Analyzed

Martingale is GAMBLING !!! #martingale #tradingshortvideo
2 years ago
•
0
•
A

Martingale is GAMBLING !!! #martingale #tradingshortvideo
0
2 years ago
Analyzed

Why Beginners Should Start With Small Capitals ? #shorts #YouTube
2 years ago
•
0
•
A

Why Beginners Should Start With Small Capitals ? #shorts #YouTube
0
2 years ago
Analyzed

Trading advertisement are BIG SCAMS !? #tradingscams
2 years ago
•
0
•
A

Trading advertisement are BIG SCAMS !? #tradingscams
0
2 years ago
Analyzed

Risk to reward ratio is very important! #shorts #riskmanagement
2 years ago
•
0
•
A

Risk to reward ratio is very important! #shorts #riskmanagement
0
2 years ago
Analyzed

Investing in money is the ultimate power move! #investment #moneymaking
2 years ago
•
0
•
A

Investing in money is the ultimate power move! #investment #moneymaking
0
2 years ago
Analyzed

Why I Don't USE STOP LOSS - SHORTS
2 years ago
•
0
•
A

Why I Don't USE STOP LOSS - SHORTS
0
2 years ago
Analyzed

Crores Of Profit in TRADING - SHORTS
2 years ago
•
0
•
A

Crores Of Profit in TRADING - SHORTS
0
2 years ago
Analyzed

FNO Is Not EASY- SHORTS
2 years ago
•
0
•
A

FNO Is Not EASY- SHORTS
0
2 years ago
Analyzed

Why Trade Goes in Opposite Direction after You Enter The Trade- Shorts
2 years ago
•
0
•
A

Why Trade Goes in Opposite Direction after You Enter The Trade- Shorts
0
2 years ago
Analyzed

CHART PATTERNS? Are They Really IMPORTANT - SHORTS
2 years ago
•
0
•
A

CHART PATTERNS? Are They Really IMPORTANT - SHORTS
0
2 years ago
Analyzed

BEST FORM of Trading
2 years ago
•
0
•
A

BEST FORM of Trading
0
2 years ago
Analyzed

Is Accuracy important in trading - Shorts #trading #tradingaccuracy
2 years ago
•
0
•
A

Is Accuracy important in trading - Shorts #trading #tradingaccuracy
0
2 years ago
Analyzed

Reality Of Trading! - Shorts #tradingshorts
2 years ago
•
0
•
A

Reality Of Trading! - Shorts #tradingshorts
0
2 years ago
Analyzed

Trading On Mobile
2 years ago
•
0
•
A

Trading On Mobile
0
2 years ago
Analyzed

Should you Drop out of College For TRADING
2 years ago
•
0
•
A

Should you Drop out of College For TRADING
0
2 years ago
Analyzed

IS FOREX even legal in India !!??
2 years ago
•
0
•
A

IS FOREX even legal in India !!??
0
2 years ago
Analyzed

Watch This Before Trading In NIFTY
2 years ago
•
1
•
A

Watch This Before Trading In NIFTY
1
2 years ago
Analyzed

Are Parents Wrong About Trading ?
2 years ago
•
0
•
A

Are Parents Wrong About Trading ?
0
2 years ago
Analyzed

Yes, Trading is Gambling !!!
2 years ago
•
0
•
A

Yes, Trading is Gambling !!!
0
2 years ago
Analyzed

The Hype about Trading
2 years ago
•
0
•
A

The Hype about Trading
0
2 years ago
Analyzed

Futures & Options is overhyped
2 years ago
•
0
•
A

Futures & Options is overhyped
0
2 years ago
Analyzed

Teenage millionaires | Do you agree?
2 years ago
•
0
•
A

Teenage millionaires | Do you agree?
0
2 years ago
Analyzed

Was Harshad Mehta Innocent?
2 years ago
•
0
•
A

Was Harshad Mehta Innocent?
0
2 years ago
Analyzed

My Biggest Trading Mistake
2 years ago
•
0
•
A

My Biggest Trading Mistake
0
2 years ago
Analyzed

Indian Youth is Gambling
2 years ago
•
0
•
A

Indian Youth is Gambling
0
2 years ago
Analyzed

New Traders After Rs 500 Profit
2 years ago
•
0
•
A

New Traders After Rs 500 Profit
0
2 years ago
Analyzed

Stop Trading
2 years ago
•
0
•
A

Stop Trading
0
2 years ago
Analyzed

Youtube ke Financial Influencers
3 years ago
•
0
•
A

Youtube ke Financial Influencers
0
3 years ago
Analyzed

Can 1 person have 2 Demat Accounts?
3 years ago
•
0
•
A

Can 1 person have 2 Demat Accounts?
0
3 years ago
Analyzed

Indian Trader caused US Stock Market Crash
3 years ago
•
0
•
A

Indian Trader caused US Stock Market Crash
0
3 years ago
Analyzed

What is Short Selling ?
3 years ago
•
0
•
A

What is Short Selling ?
0
3 years ago
Analyzed

BSE vs NSE
3 years ago
•
0
•
A

BSE vs NSE
0
3 years ago
Analyzed

World's Most Expensive Share
3 years ago
•
0
•
A

World's Most Expensive Share
0
3 years ago
Analyzed

Leaving Job For Trading
3 years ago
•
0
•
A

Leaving Job For Trading
0
3 years ago
Analyzed

Net Worth Of Rakesh Jhunjhunwala
3 years ago
•
0
•
A

Net Worth Of Rakesh Jhunjhunwala
0
3 years ago
Analyzed

FOMO - Fear Of Missing Out
3 years ago
•
0
•
A

FOMO - Fear Of Missing Out
0
3 years ago
Analyzed

Was Harshad Mehta Innocent ?
3 years ago
•
0
•
A

Was Harshad Mehta Innocent ?
0
3 years ago
Analyzed

Trading - How Many Hours Per Day?
3 years ago
•
0
•
A

Trading - How Many Hours Per Day?
0
3 years ago
Analyzed

10% Profit Daily in Trading
3 years ago
•
1
•
A

10% Profit Daily in Trading
1
3 years ago
Analyzed

Can You Make Crores in the Stock Market
3 years ago
•
0
•
A

Can You Make Crores in the Stock Market
0
3 years ago
Analyzed

Best Book For Trading Psychology
3 years ago
•
0
•
A

Best Book For Trading Psychology
0
3 years ago
Analyzed

THE NEXT BIG BULL !! ??
3 years ago
•
0
•
A

THE NEXT BIG BULL !! ??
0
3 years ago
Analyzed

Is Laptop or PC Necessary for Trading ?
3 years ago
•
0
•
A

Is Laptop or PC Necessary for Trading ?
0
3 years ago
Analyzed

How To Master Trading Psychology
3 years ago
•
0
•
A

How To Master Trading Psychology
0
3 years ago
Analyzed

Technical Analysis Vs Fundamental Analysis
3 years ago
•
0
•
A

Technical Analysis Vs Fundamental Analysis
0
3 years ago
Analyzed

Is Trading Gambling ? The Truth
3 years ago
•
0
•
A

Is Trading Gambling ? The Truth
0
3 years ago
Analyzed

BEST TIME FOR TRADING - 2 PM, 4 PM ?
3 years ago
•
0
•
A

BEST TIME FOR TRADING - 2 PM, 4 PM ?
0
3 years ago
Analyzed

Best Indicator For Trading
3 years ago
•
0
•
A

Best Indicator For Trading
0
3 years ago
Analyzed

Paid Course or Self Learning | Which one is Better?
3 years ago
•
0
•
A

Paid Course or Self Learning | Which one is Better?
0
3 years ago
Analyzed

Is Psychology important in trading
3 years ago
•
0
•
A

Is Psychology important in trading
0
3 years ago
Analyzed

Stock Market Income Explained for Beginners | Trade With Purab
5 months ago
•
0
•
No captions

Stock Market Income Explained for Beginners | Trade With Purab
0
5 months ago
No captions

Don’t Trade in the Stock Market (Until You Watch This!) | Trade with Purab
5 months ago
•
0
•
No captions
Don’t Trade in the Stock Market (Until You Watch This!) | Trade with Purab
0
5 months ago
No captions

Stop Losing Real Money! Start with Paper Trading | Trade with Purab
5 months ago
•
0
•
No captions

Stop Losing Real Money! Start with Paper Trading | Trade with Purab
0
5 months ago
No captions

Can You Really Start Trading with ₹20? | Trade with Purab
5 months ago
•
0
•
No captions

Can You Really Start Trading with ₹20? | Trade with Purab
0
5 months ago
No captions

Best Timeframe or Intraday Trading | Trade with Purab
5 months ago
•
0
•
No captions

Best Timeframe or Intraday Trading | Trade with Purab
0
5 months ago
No captions

Capital Required for Trading – Realistic Guide for Beginners | Trade with Purab
5 months ago
•
0
•
No captions

Capital Required for Trading – Realistic Guide for Beginners | Trade with Purab
0
5 months ago
No captions

Think Before You Buy That ₹1 Stock! | Trade with Purab
5 months ago
•
0
•
No captions

Think Before You Buy That ₹1 Stock! | Trade with Purab
0
5 months ago
No captions

What is Demand and Supply | Trade with Purab
5 months ago
•
0
•
No captions

What is Demand and Supply | Trade with Purab
0
5 months ago
No captions

Why Stock Prices Go Up or Down? Explained Simply | Trade with Purab
5 months ago
•
0
•
No captions

Why Stock Prices Go Up or Down? Explained Simply | Trade with Purab
0
5 months ago
No captions

Buy or Sell – Market Always Opposite! Explained | Trade with Purab
6 months ago
•
0
•
No captions

Buy or Sell – Market Always Opposite! Explained | Trade with Purab
0
6 months ago
No captions

Life Before Trading 🤡 vs Life After Trading 🗿
6 months ago
•
0
•
No captions

Life Before Trading 🤡 vs Life After Trading 🗿
0
6 months ago
No captions

New to Trading? Watch This Before You Start | Trade with Purab
6 months ago
•
0
•
No captions

New to Trading? Watch This Before You Start | Trade with Purab
0
6 months ago
No captions

Mard Ko Sirf Ek Chiz Chahiye....| Trade with Purab
6 months ago
•
0
•
No captions

Mard Ko Sirf Ek Chiz Chahiye....| Trade with Purab
0
6 months ago
No captions

Trading vs UPSC – Who’s the Real Gambler? | Trade with Purab
6 months ago
•
0
•
No captions

Trading vs UPSC – Who’s the Real Gambler? | Trade with Purab
0
6 months ago
No captions

Paisa Hi Power Hai | Trade with Purab
6 months ago
•
0
•
No captions

Paisa Hi Power Hai | Trade with Purab
0
6 months ago
No captions

When Trading is the Topic🔥| Trade with Purab
6 months ago
•
0
•
No captions

When Trading is the Topic🔥| Trade with Purab
0
6 months ago
No captions

It all Starts with a One | Trade with Purab
6 months ago
•
0
•
No captions

It all Starts with a One | Trade with Purab
0
6 months ago
No captions

Why Indian Stock Market Falls Faster Than It Rises? | Trade with Purab
6 months ago
•
0
•
No captions

Why Indian Stock Market Falls Faster Than It Rises? | Trade with Purab
0
6 months ago
No captions

Stop Overcomplicating Fibonacci Retracement – Learn It Right!
6 months ago
•
0
•
No captions

Stop Overcomplicating Fibonacci Retracement – Learn It Right!
0
6 months ago
No captions

Price Action vs Smart Money vs ICT – Which One is Best?
6 months ago
•
0
•
No captions

Price Action vs Smart Money vs ICT – Which One is Best?
0
6 months ago
No captions

Do this During Market Crash | Trade with Purab
6 months ago
•
0
•
No captions

Do this During Market Crash | Trade with Purab
0
6 months ago
No captions

Still Don’t Understand Support & Resistance? Watch This! | Trade with Purab
6 months ago
•
0
•
No captions

Still Don’t Understand Support & Resistance? Watch This! | Trade with Purab
0
6 months ago
No captions

How to Start Trading from Scratch | Trade with Purab
6 months ago
•
0
•
No captions

How to Start Trading from Scratch | Trade with Purab
0
6 months ago
No captions

Don’t Invest in Any Company Without Watching This | Trade with Purab
6 months ago
•
0
•
No captions

Don’t Invest in Any Company Without Watching This | Trade with Purab
0
6 months ago
No captions

Stock Market Mein Paisa Gaya… | Trade with Purab
6 months ago
•
0
•
No captions

Stock Market Mein Paisa Gaya… | Trade with Purab
0
6 months ago
No captions

Minimum Capital Required to Start Trading | Trade with Purab
6 months ago
•
0
•
No captions

Minimum Capital Required to Start Trading | Trade with Purab
0
6 months ago
No captions

Which Stock to Trade? Simple Guide for Beginners! | Trade with Purab
6 months ago
•
0
•
No captions

Which Stock to Trade? Simple Guide for Beginners! | Trade with Purab
0
6 months ago
No captions

What is Spread in Forex Trading ? | Trade with Purab
6 months ago
•
0
•
No captions

What is Spread in Forex Trading ? | Trade with Purab
0
6 months ago
No captions

Kya Trading Asaan Hai ? | Trade with Purab
6 months ago
•
0
•
No captions

Kya Trading Asaan Hai ? | Trade with Purab
0
6 months ago
No captions

Best Channels to Learn Trading From | Trade with Purab
6 months ago
•
0
•
No captions

Best Channels to Learn Trading From | Trade with Purab
0
6 months ago
No captions

Best Technical Analysis Tool | Trade with Purab
6 months ago
•
0
•
No captions

Best Technical Analysis Tool | Trade with Purab
0
6 months ago
No captions

How to Avoid Bank Account Freeze in Forex | Trade with Purab
6 months ago
•
0
•
No captions

How to Avoid Bank Account Freeze in Forex | Trade with Purab
0
6 months ago
No captions

Best Tool for Trading | Trade with Purab
6 months ago
•
0
•
No captions

Best Tool for Trading | Trade with Purab
0
6 months ago
No captions

What Drives Market Movements? | Trade with Purab
7 months ago
•
0
•
No captions

What Drives Market Movements? | Trade with Purab
0
7 months ago
No captions

What is NSE and BSE ? | Trade with Purab
7 months ago
•
0
•
No captions

What is NSE and BSE ? | Trade with Purab
0
7 months ago
No captions

Understanding Stock Categories: Small, Mid, and Large Cap | Trade with Purab
7 months ago
•
0
•
No captions

Understanding Stock Categories: Small, Mid, and Large Cap | Trade with Purab
0
7 months ago
No captions

Trading Lessons from Bruce Lee | Trade with Purab
7 months ago
•
0
•
No captions

Trading Lessons from Bruce Lee | Trade with Purab
0
7 months ago
No captions

Best Books for Trading | Trade with Purab
7 months ago
•
0
•
No captions

Best Books for Trading | Trade with Purab
0
7 months ago
No captions

Overtrading Almost Broke Me | Trade with Purab
7 months ago
•
0
•
No captions

Overtrading Almost Broke Me | Trade with Purab
0
7 months ago
No captions

100-day Trading Learning Challenge! | Trade with Purab
7 months ago
•
0
•
No captions

100-day Trading Learning Challenge! | Trade with Purab
0
7 months ago
No captions

Trading is all about EXPERIENCE | Trade with Purab
7 months ago
•
0
•
No captions

Trading is all about EXPERIENCE | Trade with Purab
0
7 months ago
No captions

Best Time to Invest in Stocks | Trade with Purab
7 months ago
•
0
•
No captions

Best Time to Invest in Stocks | Trade with Purab
0
7 months ago
No captions

Don't Start Trading Before Watching this Video | Trade with Purab
7 months ago
•
0
•
No captions

Don't Start Trading Before Watching this Video | Trade with Purab
0
7 months ago
No captions

Trading Guide for Beginners | Trade with Purab
7 months ago
•
0
•
No captions

Trading Guide for Beginners | Trade with Purab
0
7 months ago
No captions

Best YouTube Videos to Learn Trading (Step-by-Step Guide) | Trade with Purab
7 months ago
•
0
•
No captions

Best YouTube Videos to Learn Trading (Step-by-Step Guide) | Trade with Purab
0
7 months ago
No captions

SEBI Explained for Beginners | Trade with Purab
7 months ago
•
0
•
No captions

SEBI Explained for Beginners | Trade with Purab
0
7 months ago
No captions

Smart Way to Start Trading | Trade with Purab
7 months ago
•
0
•
No captions

Smart Way to Start Trading | Trade with Purab
0
7 months ago
No captions

Is It Easy to Make Money in Trading? | Trade with Purab
7 months ago
•
0
•
No captions

Is It Easy to Make Money in Trading? | Trade with Purab
0
7 months ago
No captions

More Addictive Than Any Game | Trade with Purab
7 months ago
•
0
•
No captions

More Addictive Than Any Game | Trade with Purab
0
7 months ago
No captions

Before You Trade with Real Money, Watch This | Trade with Purab
7 months ago
•
0
•
No captions

Before You Trade with Real Money, Watch This | Trade with Purab
0
7 months ago
No captions

Trading is Not for Everyone | Trade with Purab
7 months ago
•
0
•
No captions

Trading is Not for Everyone | Trade with Purab
0
7 months ago
No captions

Importance of Stop-Loss | Trade with Purab
7 months ago
•
0
•
No captions

Importance of Stop-Loss | Trade with Purab
0
7 months ago
No captions

Share Market Explained with Cadbury | Trade with Purab
7 months ago
•
0
•
No captions

Share Market Explained with Cadbury | Trade with Purab
0
7 months ago
No captions

Why You Should Expect Losses | Trade with Purab
7 months ago
•
0
•
No captions

Why You Should Expect Losses | Trade with Purab
0
7 months ago
No captions

The Truth About Losses | Trade with Purab
7 months ago
•
0
•
No captions

The Truth About Losses | Trade with Purab
0
7 months ago
No captions

Is Stock Market Complicated? | Trade with Purab
7 months ago
•
0
•
No captions

Is Stock Market Complicated? | Trade with Purab
0
7 months ago
No captions

Safe Way to Avoid Bank Freeze | Trade with Purab
7 months ago
•
0
•
No captions

Safe Way to Avoid Bank Freeze | Trade with Purab
0
7 months ago
No captions

Can You Target 5k₹ Daily in Trading ? | Trade with Purab
7 months ago
•
0
•
No captions

Can You Target 5k₹ Daily in Trading ? | Trade with Purab
0
7 months ago
No captions

Forex vs Stock Market | Trade with Purab
7 months ago
•
0
•
No captions

Forex vs Stock Market | Trade with Purab
0
7 months ago
No captions

Build Your Trading Foundation | Trade with Purab
7 months ago
•
0
•
No captions

Build Your Trading Foundation | Trade with Purab
0
7 months ago
No captions

What is Dow Theory ? | Trade with Purab
7 months ago
•
0
•
No captions

What is Dow Theory ? | Trade with Purab
0
7 months ago
No captions

Learn Stock Market for Free | Trade with Purab
7 months ago
•
0
•
No captions

Learn Stock Market for Free | Trade with Purab
0
7 months ago
No captions

Trading Requires Patience | Trade with Purab
7 months ago
•
0
•
No captions

Trading Requires Patience | Trade with Purab
0
7 months ago
No captions

80% Traders are Fake | Trade with Purab
7 months ago
•
0
•
No captions

80% Traders are Fake | Trade with Purab
0
7 months ago
No captions
Trading Mistakes you should avoid as a Beginner - Trade with Purab
7 months ago
•
0
•
No captions

Trading Mistakes you should avoid as a Beginner - Trade with Purab
0
7 months ago
No captions

Trading ke liye Capital | Trade with Purab
7 months ago
•
0
•
No captions

Trading ke liye Capital | Trade with Purab
0
7 months ago
No captions

Chai and Trading | Trade with Purab
7 months ago
•
0
•
No captions

Chai and Trading | Trade with Purab
0
7 months ago
No captions

Trading Will Only Reward You When....| Trade with Purab
7 months ago
•
0
•
No captions

Trading Will Only Reward You When....| Trade with Purab
0
7 months ago
No captions

Trading Roadmap for Beginners - Trade with Purab
7 months ago
•
0
•
No captions

Trading Roadmap for Beginners - Trade with Purab
0
7 months ago
No captions

Maine Kar Ke Dikha Diya | Trade with Purab
7 months ago
•
0
•
No captions

Maine Kar Ke Dikha Diya | Trade with Purab
0
7 months ago
No captions

Three Best Movies for Trading | Trade with Purab
7 months ago
•
0
•
No captions

Three Best Movies for Trading | Trade with Purab
0
7 months ago
No captions

Stock Market and Sarojini | Trade with Purab
7 months ago
•
0
•
No captions

Stock Market and Sarojini | Trade with Purab
0
7 months ago
No captions

Most Loss Making Strategy | Trade with Purab | Trade with Purab
7 months ago
•
0
•
No captions

Most Loss Making Strategy | Trade with Purab | Trade with Purab
0
7 months ago
No captions

Community for Traders | Trade with Purab
7 months ago
•
0
•
No captions

Community for Traders | Trade with Purab
0
7 months ago
No captions

The Best Trading Community | Trade with Purab
7 months ago
•
0
•
No captions

The Best Trading Community | Trade with Purab
0
7 months ago
No captions
Supply and Demand Explained | Trade with Purab
7 months ago
•
0
•
No captions

Supply and Demand Explained | Trade with Purab
0
7 months ago
No captions

Trading Require Sacrifices | Trade with Purab
7 months ago
•
0
•
No captions

Trading Require Sacrifices | Trade with Purab
0
7 months ago
No captions

Buy Top 50 Companies with ₹30 | Trade with Purab
7 months ago
•
0
•
No captions

Buy Top 50 Companies with ₹30 | Trade with Purab
0
7 months ago
No captions

Struggles of a Trader – Join a Real Trading Community! | Trade with Purab
7 months ago
•
0
•
No captions

Struggles of a Trader – Join a Real Trading Community! | Trade with Purab
0
7 months ago
No captions

Support and Resistance Explained - Trade with Purab
7 months ago
•
0
•
No captions

Support and Resistance Explained - Trade with Purab
0
7 months ago
No captions

Maa Tere Saare Sapne Pure Karne Ka Vardaan Hai | Purab Darda
7 months ago
•
0
•
No captions

Maa Tere Saare Sapne Pure Karne Ka Vardaan Hai | Purab Darda
0
7 months ago
No captions

Ye Kamaya Hai Maine | Trade with Purab
7 months ago
•
0
•
No captions

Ye Kamaya Hai Maine | Trade with Purab
0
7 months ago
No captions

Start Trading with Phone | Trade with Purab
7 months ago
•
0
•
No captions

Start Trading with Phone | Trade with Purab
0
7 months ago
No captions

Status 😮💨 | Trade with Purab
7 months ago
•
0
•
No captions

Status 😮💨 | Trade with Purab
0
7 months ago
No captions

Bass khud par bharosa tha 💪 | Trade with Purab
7 months ago
•
0
•
No captions

Bass khud par bharosa tha 💪 | Trade with Purab
0
7 months ago
No captions

Aisa Beta Sabko Mile | Trade with Purab
7 months ago
•
0
•
No captions

Aisa Beta Sabko Mile | Trade with Purab
0
7 months ago
No captions

Learn the Language of Trading | Trade with Purab
7 months ago
•
0
•
No captions

Learn the Language of Trading | Trade with Purab
0
7 months ago
No captions

Can You Hit ₹5K/Day in Trading? - Trade with Purab
8 months ago
•
0
•
No captions

Can You Hit ₹5K/Day in Trading? - Trade with Purab
0
8 months ago
No captions

Understand Share Market with Cadbury - Trade with Purab
8 months ago
•
0
•
No captions

Understand Share Market with Cadbury - Trade with Purab
0
8 months ago
No captions

Dow Theory Explained - Trade with Purab
8 months ago
•
0
•
No captions

Dow Theory Explained - Trade with Purab
0
8 months ago
No captions

90% Traders Quit - Trade with Purab
8 months ago
•
0
•
No captions

90% Traders Quit - Trade with Purab
0
8 months ago
No captions

Trading Rules - Trade with Purab
8 months ago
•
0
•
No captions

Trading Rules - Trade with Purab
0
8 months ago
No captions

2025 Complete Trading Plan - Trade with Purab
8 months ago
•
0
•
No captions

2025 Complete Trading Plan - Trade with Purab
0
8 months ago
No captions

4 Best YouTube Trading Channels - Trade with Purab
8 months ago
•
0
•
No captions

4 Best YouTube Trading Channels - Trade with Purab
0
8 months ago
No captions

Trading Mistakes to Avoid in 2025 - Trade with Purab
8 months ago
•
0
•
No captions

Trading Mistakes to Avoid in 2025 - Trade with Purab
0
8 months ago
No captions

3 Best Trading Course in YouTube - Trade with Purab
8 months ago
•
0
•
No captions

3 Best Trading Course in YouTube - Trade with Purab
0
8 months ago
No captions

Trading Chart Patterns in 1 min - Trade with Purab
8 months ago
•
0
•
No captions

Trading Chart Patterns in 1 min - Trade with Purab
0
8 months ago
No captions

Before You Start Trading, Watch This - Trade with Purab
8 months ago
•
0
•
No captions

Before You Start Trading, Watch This - Trade with Purab
0
8 months ago
No captions

Can Trading be Addictive - Trade with Purab
8 months ago
•
0
•
No captions

Can Trading be Addictive - Trade with Purab
0
8 months ago
No captions

Learn Candlestick Patterns | Trade with Purab
8 months ago
•
0
•
No captions

Learn Candlestick Patterns | Trade with Purab
0
8 months ago
No captions

Bank Account Freeze ❌| Trade with Purab
8 months ago
•
0
•
No captions

Bank Account Freeze ❌| Trade with Purab
0
8 months ago
No captions

Trading with Chips - Trade with Purab
8 months ago
•
0
•
No captions

Trading with Chips - Trade with Purab
0
8 months ago
No captions

Loss in Trading - Trade with Purab
8 months ago
•
0
•
No captions

Loss in Trading - Trade with Purab
0
8 months ago
No captions

Want to Start Trading - Trade with Purab
8 months ago
•
0
•
No captions

Want to Start Trading - Trade with Purab
0
8 months ago
No captions

What is SMC? - Trade with Purab
8 months ago
•
0
•
No captions

What is SMC? - Trade with Purab
0
8 months ago
No captions

Equity Trading vs Options Trading - Trade with Purab
9 months ago
•
0
•
No captions

Equity Trading vs Options Trading - Trade with Purab
0
9 months ago
No captions

How to Draw Trendlines Accurately - Trade with Purab
9 months ago
•
0
•
No captions

How to Draw Trendlines Accurately - Trade with Purab
0
9 months ago
No captions

Best time to enter the Market - Trade with Purab
9 months ago
•
0
•
No captions

Best time to enter the Market - Trade with Purab
0
9 months ago
No captions

Why beginners lose money in trading - Trade with Purab
9 months ago
•
0
•
No captions

Why beginners lose money in trading - Trade with Purab
0
9 months ago
No captions

Yes ! You can Make money in Trading | Trade with Purab
9 months ago
•
0
•
No captions

Yes ! You can Make money in Trading | Trade with Purab
0
9 months ago
No captions

Why Most Traders Fail - Trade with Purab
9 months ago
•
0
•
No captions

Why Most Traders Fail - Trade with Purab
0
9 months ago
No captions

Support and Resistance in 30 seconds - Trade with Purab
9 months ago
•
0
•
No captions

Support and Resistance in 30 seconds - Trade with Purab
0
9 months ago
No captions

Learn Trading For FREE - Trade with Purab
9 months ago
•
0
•
No captions

Learn Trading For FREE - Trade with Purab
0
9 months ago
No captions

Websites for Traders - Trade with Purab
9 months ago
•
0
•
No captions

Websites for Traders - Trade with Purab
0
9 months ago
No captions

What is SEBI? - Trade with Purab
9 months ago
•
0
•
No captions

What is SEBI? - Trade with Purab
0
9 months ago
No captions

Trade with Fake Money - Trade with Purab
9 months ago
•
0
•
No captions

Trade with Fake Money - Trade with Purab
0
9 months ago
No captions

Bank Account Freeze ❌ - Trade with Purab
9 months ago
•
0
•
No captions

Bank Account Freeze ❌ - Trade with Purab
0
9 months ago
No captions

Must Watch Movies for Traders - Trade with Purab
9 months ago
•
0
•
No captions

Must Watch Movies for Traders - Trade with Purab
0
9 months ago
No captions

Trading in 2025 - Trade with Purab
9 months ago
•
0
•
No captions

Trading in 2025 - Trade with Purab
0
9 months ago
No captions

Phone and Trading | Trade with Purab
9 months ago
•
0
•
No captions

Phone and Trading | Trade with Purab
0
9 months ago
No captions

Best Software to Analyse Trading Charts - Trade with Purab
9 months ago
•
0
•
No captions

Best Software to Analyse Trading Charts - Trade with Purab
0
9 months ago
No captions

Traders are Lying - Trade with Purab
9 months ago
•
0
•
No captions

Traders are Lying - Trade with Purab
0
9 months ago
No captions

Understand the Language of Trading - Trade with Purab
9 months ago
•
0
•
No captions

Understand the Language of Trading - Trade with Purab
0
9 months ago
No captions

Aisa loss mere saath hi kyu hota hai? - Trade with Purab
9 months ago
•
0
•
No captions

Aisa loss mere saath hi kyu hota hai? - Trade with Purab
0
9 months ago
No captions

What is a Stock Exchange? - Trade with Purab
9 months ago
•
0
•
No captions

What is a Stock Exchange? - Trade with Purab
0
9 months ago
No captions

Are you still making this big trading mistake - Trade with Purab
9 months ago
•
0
•
No captions

Are you still making this big trading mistake - Trade with Purab
0
9 months ago
No captions

How Supply and Demand Really Works - Trade with Purab
9 months ago
•
0
•
No captions

How Supply and Demand Really Works - Trade with Purab
0
9 months ago
No captions

Basics of Trading - Trade with Purab
9 months ago
•
0
•
No captions

Basics of Trading - Trade with Purab
0
9 months ago
No captions

Chai aur Stock market - Trade with Purab
9 months ago
•
0
•
No captions

Chai aur Stock market - Trade with Purab
0
9 months ago
No captions

Bad Strategy? - Trade With Purab
9 months ago
•
0
•
No captions

Bad Strategy? - Trade With Purab
0
9 months ago
No captions

Facing Huge loses in Trading ? | Trade with Purab
9 months ago
•
0
•
No captions

Facing Huge loses in Trading ? | Trade with Purab
0
9 months ago
No captions

Why Only 3 % People Make Profits in Trading | Trade with Purab
9 months ago
•
0
•
No captions

Why Only 3 % People Make Profits in Trading | Trade with Purab
0
9 months ago
No captions

How Support and Resistance Really Work - Trade with Purab
9 months ago
•
0
•
No captions

How Support and Resistance Really Work - Trade with Purab
0
9 months ago
No captions

My Worst Trading Mistake | Trade with Purab
9 months ago
•
0
•
No captions

My Worst Trading Mistake | Trade with Purab
0
9 months ago
No captions

3 Best Trading Tools - Trade with Purab
9 months ago
•
0
•
No captions

3 Best Trading Tools - Trade with Purab
0
9 months ago
No captions

Every Trader Needs to Hear This - Trade with Purab
9 months ago
•
0
•
No captions

Every Trader Needs to Hear This - Trade with Purab
0
9 months ago
No captions

How to Find a Perfect Trade - Trade with Purab
9 months ago
•
0
•
No captions

How to Find a Perfect Trade - Trade with Purab
0
9 months ago
No captions

Understand the Language of Trading | Trade with Purab
9 months ago
•
0
•
No captions

Understand the Language of Trading | Trade with Purab
0
9 months ago
No captions

Never Trade Without These 3 Confirmations | Trade with Purab
9 months ago
•
0
•
No captions

Never Trade Without These 3 Confirmations | Trade with Purab
0
9 months ago
No captions

I Lost Everything in Overtrading | Trade with Purab
9 months ago
•
0
•
No captions

I Lost Everything in Overtrading | Trade with Purab
0
9 months ago
No captions

Trading Sabhke liye nhi hai – Trade with Purab
9 months ago
•
0
•
No captions

Trading Sabhke liye nhi hai – Trade with Purab
0
9 months ago
No captions

Trading Mindset you Need | Trade with Purab
9 months ago
•
0
•
No captions

Trading Mindset you Need | Trade with Purab
0
9 months ago
No captions

Stop Loss in Trading – Simple Explanation | Trade with Purab
9 months ago
•
0
•
No captions

Stop Loss in Trading – Simple Explanation | Trade with Purab
0
9 months ago
No captions

Stock Market vs Forex Market – Which Is Better ? | Trade with Purab
9 months ago
•
0
•
No captions

Stock Market vs Forex Market – Which Is Better ? | Trade with Purab
0
9 months ago
No captions

Stock Market complicated nahi hai ? | Trade with Purab
9 months ago
•
0
•
No captions

Stock Market complicated nahi hai ? | Trade with Purab
0
9 months ago
No captions

Simple Guide to Technical Analysis for Beginners | Trade with Purab
9 months ago
•
0
•
No captions

Simple Guide to Technical Analysis for Beginners | Trade with Purab
0
9 months ago
No captions

Must-Knows Before You Start Trading | Trade with Purab
9 months ago
•
0
•
No captions

Must-Knows Before You Start Trading | Trade with Purab
0
9 months ago
No captions

Stock Market for Beginners | How it Works - Trade with Purab
9 months ago
•
0
•
No captions

Stock Market for Beginners | How it Works - Trade with Purab
0
9 months ago
No captions

Step-by-Step Guide to Start Trading | Trade with Purab
9 months ago
•
0
•
No captions

Step-by-Step Guide to Start Trading | Trade with Purab
0
9 months ago
No captions

Demand and Supply Explained | Trade with Purab
9 months ago
•
0
•
No captions

Demand and Supply Explained | Trade with Purab
0
9 months ago
No captions

Best Free YouTube Channels to Learn Trading in 2025 | Trade with Purab #trading
9 months ago
•
0
•
No captions

Best Free YouTube Channels to Learn Trading in 2025 | Trade with Purab #trading
0
9 months ago
No captions

Understand How Stock Market Works - Trade with Purab
9 months ago
•
0
•
No captions

Understand How Stock Market Works - Trade with Purab
0
9 months ago
No captions

Below 18- Want to Start Trading ✅| Trade with Purab
9 months ago
•
0
•
No captions

Below 18- Want to Start Trading ✅| Trade with Purab
0
9 months ago
No captions

Volume Explained | How to use Volume in Trading - Trade with Purab
9 months ago
•
0
•
No captions

Volume Explained | How to use Volume in Trading - Trade with Purab
0
9 months ago
No captions

Best Trading Books - Trade with Purab #tradingbooks
9 months ago
•
0
•
No captions

Best Trading Books - Trade with Purab #tradingbooks
0
9 months ago
No captions

Paper Trading Tutorial - How to do Paper Trading | Trade with Purab
9 months ago
•
0
•
No captions

Paper Trading Tutorial - How to do Paper Trading | Trade with Purab
0
9 months ago
No captions

My Trading Plan if I had to start again from Scratch | Trade with Purab
9 months ago
•
0
•
No captions

My Trading Plan if I had to start again from Scratch | Trade with Purab
0
9 months ago
No captions

5 Trading Mistakes That Cost Me Lakhs in Losses! 💸🚨 | Trade with Purab
10 months ago
•
0
•
No captions

5 Trading Mistakes That Cost Me Lakhs in Losses! 💸🚨 | Trade with Purab
0
10 months ago
No captions

How to Grow Capital in Trading | Step by Step Guide 🚀
10 months ago
•
0
•
No captions

How to Grow Capital in Trading | Step by Step Guide 🚀
0
10 months ago
No captions

What is Intraday Trading? | Intraday Crash Course 2025 🔥📈
10 months ago
•
0
•
No captions

What is Intraday Trading? | Intraday Crash Course 2025 🔥📈
0
10 months ago
No captions

Traders - Time to Leave India 🇮🇳😭 - Why Traders Move to Dubai
10 months ago
•
0
•
No captions

Traders - Time to Leave India 🇮🇳😭 - Why Traders Move to Dubai
0
10 months ago
No captions
Candlestick Patterns Hack - Find all Candlestick patterns in 1 minute | Trade with Purab
10 months ago
•
0
•
No captions
Candlestick Patterns Hack - Find all Candlestick patterns in 1 minute | Trade with Purab
0
10 months ago
No captions

Biggest Trading Mistake that cost me Crores in Losses ! Trade with Purab
10 months ago
•
0
•
No captions

Biggest Trading Mistake that cost me Crores in Losses ! Trade with Purab
0
10 months ago
No captions

Top 5 Trading Websites that Pro Traders Use🔥| Trade with Purab
10 months ago
•
0
•
No captions
Top 5 Trading Websites that Pro Traders Use🔥| Trade with Purab
0
10 months ago
No captions

How to Start Trading in 2025 - Free Guide | Trade with Purab
10 months ago
•
0
•
No captions

How to Start Trading in 2025 - Free Guide | Trade with Purab
0
10 months ago
No captions

The Power of Price Action Trading 🔥 | Trade with Purab
10 months ago
•
0
•
No captions

The Power of Price Action Trading 🔥 | Trade with Purab
0
10 months ago
No captions

Bas ₹30 Rupaye Me Shuru Karo Apni Investing Journey 😱📈 | Trade with Purab
10 months ago
•
0
•
No captions

Bas ₹30 Rupaye Me Shuru Karo Apni Investing Journey 😱📈 | Trade with Purab
0
10 months ago
No captions

The Market is on SALE 🤯🔥| Trade with Purab
10 months ago
•
0
•
No captions

The Market is on SALE 🤯🔥| Trade with Purab
0
10 months ago
No captions

Want to Win in Trading ? 🚀 | Trade with Purab
11 months ago
•
0
•
No captions

Want to Win in Trading ? 🚀 | Trade with Purab
0
11 months ago
No captions

The Biggest Candlestick Mistake Traders Make 😱🚀 | Trade with Purab
11 months ago
•
0
•
No captions

The Biggest Candlestick Mistake Traders Make 😱🚀 | Trade with Purab
0
11 months ago
No captions

Trading Is NOT for You ❌📈 | Trade with Purab
11 months ago
•
0
•
No captions

Trading Is NOT for You ❌📈 | Trade with Purab
0
11 months ago
No captions

Master These Chart Patterns & Unlock Your Trading Success 🚀 | Trade with Purab
11 months ago
•
0
•
No captions

Master These Chart Patterns & Unlock Your Trading Success 🚀 | Trade with Purab
0
11 months ago
No captions

5 Best Trading Apps for Every Pro Trader | Trade with Purab
11 months ago
•
0
•
No captions

5 Best Trading Apps for Every Pro Trader | Trade with Purab
0
11 months ago
No captions

Why Most Traders Fail ? 😱 📉 | Trade with Purab
11 months ago
•
0
•
No captions

Why Most Traders Fail ? 😱 📉 | Trade with Purab
0
11 months ago
No captions

Best Trading Tools for Smart Traders - Trade with Purab
11 months ago
•
0
•
No captions

Best Trading Tools for Smart Traders - Trade with Purab
0
11 months ago
No captions

90% Traders Fail in Trading ? 😱📉 | Trade with Purab
11 months ago
•
0
•
No captions

90% Traders Fail in Trading ? 😱📉 | Trade with Purab
0
11 months ago
No captions

Wishing you strength in every battle ❤️ | Trade with Purab #brother
11 months ago
•
0
•
No captions

Wishing you strength in every battle ❤️ | Trade with Purab #brother
0
11 months ago
No captions

90% Traders Use Wrong Time Frames ❌📉 | Trade with Purab
11 months ago
•
0
•
No captions

90% Traders Use Wrong Time Frames ❌📉 | Trade with Purab
0
11 months ago
No captions

These 4 Books Can Make You a Pro Trader 📙🔥| Trade with Purab
11 months ago
•
0
•
No captions

These 4 Books Can Make You a Pro Trader 📙🔥| Trade with Purab
0
11 months ago
No captions

One Trick to Master Support & Resistance 🎯 | Trade with Purab
11 months ago
•
0
•
No captions

One Trick to Master Support & Resistance 🎯 | Trade with Purab
0
11 months ago
No captions

This ONE Skill Can Make You Rich 💸 | Trade with Purab
11 months ago
•
0
•
No captions

This ONE Skill Can Make You Rich 💸 | Trade with Purab
0
11 months ago
No captions

One Mistake That’s Killing Your Trading Profits 📉 | Trade with Purab
11 months ago
•
0
•
No captions

One Mistake That’s Killing Your Trading Profits 📉 | Trade with Purab
0
11 months ago
No captions

3 Reasons Why Stock Prices Fluctuate 😱📊 | Trade with Purab
11 months ago
•
0
•
No captions

3 Reasons Why Stock Prices Fluctuate 😱📊 | Trade with Purab
0
11 months ago
No captions

Pura Stock Market Bilkul FREE Mein Seekho 😱🔥| Trade with Purab
11 months ago
•
0
•
No captions

Pura Stock Market Bilkul FREE Mein Seekho 😱🔥| Trade with Purab
0
11 months ago
No captions

Be that Man ❤️ | Trade with Purab #motivation
11 months ago
•
0
•
No captions

Be that Man ❤️ | Trade with Purab #motivation
0
11 months ago
No captions

Best Trend Lines Strategy ✅ | Trade with Purab
11 months ago
•
0
•
No captions

Best Trend Lines Strategy ✅ | Trade with Purab
0
11 months ago
No captions

3 Best Courses in Trading Market | Trade with Purab
11 months ago
•
0
•
No captions

3 Best Courses in Trading Market | Trade with Purab
0
11 months ago
No captions

Keep moving Forward 🔥| Trade with Purab #motivation
11 months ago
•
0
•
No captions

Keep moving Forward 🔥| Trade with Purab #motivation
0
11 months ago
No captions

Forex Trading Me Bank Account Freeze Hone Se Kaise Bachein? | Trade with Purab
11 months ago
•
0
•
No captions

Forex Trading Me Bank Account Freeze Hone Se Kaise Bachein? | Trade with Purab
0
11 months ago
No captions

1 Trading Indicator Jisne meri life badal di? | Trade with Purab
11 months ago
•
0
•
No captions

1 Trading Indicator Jisne meri life badal di? | Trade with Purab
0
11 months ago
No captions

I will always Choose to be kind | Trade with Purab
11 months ago
•
0
•
No captions

I will always Choose to be kind | Trade with Purab
0
11 months ago
No captions

You’re not Special 😮💨 | Trade with Purab #motivation #trader #shorts
1 year ago
•
0
•
No captions

You’re not Special 😮💨 | Trade with Purab #motivation #trader #shorts
0
1 year ago
No captions

Story of a Trader | Trade with Purab #daytrader #shorts
1 year ago
•
0
•
No captions

Story of a Trader | Trade with Purab #daytrader #shorts
0
1 year ago
No captions

Reason why I don’t Quit Trading 📈❌ | Trade with Purab #success #shorts
1 year ago
•
0
•
No captions

Reason why I don’t Quit Trading 📈❌ | Trade with Purab #success #shorts
0
1 year ago
No captions

What we do at Night - Trader’s life | Trade with Purab
1 year ago
•
0
•
No captions

What we do at Night - Trader’s life | Trade with Purab
0
1 year ago
No captions

Risk now, regret never | Trade with Purab #risktaker #motivational
1 year ago
•
0
•
No captions

Risk now, regret never | Trade with Purab #risktaker #motivational
0
1 year ago
No captions

Aaj Elon Musk Ke Saath kurkure kha Raha Hota #tradingmeme #shorts
1 year ago
•
0
•
No captions

Aaj Elon Musk Ke Saath kurkure kha Raha Hota #tradingmeme #shorts
0
1 year ago
No captions

Market ke Chalak Moves ⚡📊| Trading Memes | Trade with Purab
1 year ago
•
0
•
No captions

Market ke Chalak Moves ⚡📊| Trading Memes | Trade with Purab
0
1 year ago
No captions

Apne saath dost ko bhi le duba ! 📉😅| Trading Memes | Trade with Purab #tranding
1 year ago
•
0
•
No captions

Apne saath dost ko bhi le duba ! 📉😅| Trading Memes | Trade with Purab #tranding
0
1 year ago
No captions

Story of Intraday Trader | Trade with Purab
1 year ago
•
0
•
No captions

Story of Intraday Trader | Trade with Purab
0
1 year ago
No captions

The Journey That Changed Everything – My Story | Trade with Purab | #motivation
1 year ago
•
0
•
No captions

The Journey That Changed Everything – My Story | Trade with Purab | #motivation
0
1 year ago
No captions

Me giving perfect Trading Advice 💀 | Trade with Purab #tradingmemes #shorts
1 year ago
•
0
•
No captions

Me giving perfect Trading Advice 💀 | Trade with Purab #tradingmemes #shorts
0
1 year ago
No captions

Trader Vs Profit | Profits in Trading😭😂 Trade with Purab
1 year ago
•
0
•
No captions

Trader Vs Profit | Profits in Trading😭😂 Trade with Purab
0
1 year ago
No captions

In the trading rush, I trust Bank Nifty | Trade with Purab #trading #banknifty #shorts
1 year ago
•
0
•
No captions

In the trading rush, I trust Bank Nifty | Trade with Purab #trading #banknifty #shorts
0
1 year ago
No captions

Trading took time, but it’s worth it | Trade with Purab #shorts #success #trader
1 year ago
•
0
•
No captions

Trading took time, but it’s worth it | Trade with Purab #shorts #success #trader
0
1 year ago
No captions

Dreams Do Come True 🥺🧿 | Trade with Purab #believeinyourself #motivation #shorts
1 year ago
•
0
•
No captions

Dreams Do Come True 🥺🧿 | Trade with Purab #believeinyourself #motivation #shorts
0
1 year ago
No captions

Why I want to become a trader | Trader with Purab #doglover #shorts
1 year ago
•
0
•
No captions

Why I want to become a trader | Trader with Purab #doglover #shorts
0
1 year ago
No captions

Just believe in yourself | Trade with Purab #motivation #shorts
1 year ago
•
0
•
No captions

Just believe in yourself | Trade with Purab #motivation #shorts
0
1 year ago
No captions

Mai profit booking nahi kar sakta kya😭| Trade with Purab #shorts #funny
1 year ago
•
0
•
No captions

Mai profit booking nahi kar sakta kya😭| Trade with Purab #shorts #funny
0
1 year ago
No captions

Profit nahi loss ki baat hori hai | Trade with Purab #tradingmemes #shorts
1 year ago
•
0
•
No captions
Profit nahi loss ki baat hori hai | Trade with Purab #tradingmemes #shorts
0
1 year ago
No captions

Ab trading me loss hi ho raha hai | Trade with Purab #tradingmemes #tradingloss #shorts
1 year ago
•
0
•
No captions

Ab trading me loss hi ho raha hai | Trade with Purab #tradingmemes #tradingloss #shorts
0
1 year ago
No captions

Me While Trading | Trade with Purab #trader #shorts
1 year ago
•
0
•
No captions
Me While Trading | Trade with Purab #trader #shorts
0
1 year ago
No captions

Mere Profits ko nazar pehle lagate hai | Trade with Purab #shorts #tradingmemes
1 year ago
•
0
•
No captions

Mere Profits ko nazar pehle lagate hai | Trade with Purab #shorts #tradingmemes
0
1 year ago
No captions

Me at age of 17 Vs at the age of 21 | Trade with Purab #motivation #shorts
1 year ago
•
0
•
No captions

Me at age of 17 Vs at the age of 21 | Trade with Purab #motivation #shorts
0
1 year ago
No captions

It doesn’t make sense until you make it | Trade with Purab #motivation #shorts
1 year ago
•
0
•
No captions

It doesn’t make sense until you make it | Trade with Purab #motivation #shorts
0
1 year ago
No captions

A Trader’s Journey - from Loss to Profit🔥📈 | Trade with Purab #tradingjourney #shorts
1 year ago
•
0
•
No captions

A Trader’s Journey - from Loss to Profit🔥📈 | Trade with Purab #tradingjourney #shorts
0
1 year ago
No captions

Trading is Love | Trade with Purab #trading #shorts
1 year ago
•
0
•
No captions

Trading is Love | Trade with Purab #trading #shorts
0
1 year ago
No captions

Don’t do Trading, You’ll Regret it ❌🙅♂️ | Trade with Purab #trading #motivation #shorts
1 year ago
•
0
•
No captions

Don’t do Trading, You’ll Regret it ❌🙅♂️ | Trade with Purab #trading #motivation #shorts
0
1 year ago
No captions

Ek Trader ka Maksad 💀😱 | Trade with Purab #shorts #trading
1 year ago
•
0
•
No captions

Ek Trader ka Maksad 💀😱 | Trade with Purab #shorts #trading
0
1 year ago
No captions

Dusri Kidney Trading karne ke liye hai | Trade with Purab #tradingmemes #trading #shortsvideo
1 year ago
•
0
•
No captions

Dusri Kidney Trading karne ke liye hai | Trade with Purab #tradingmemes #trading #shortsvideo
0
1 year ago
No captions

Losing at the start only makes winning later sweeter | Trade with Purab #motivation #shorts
1 year ago
•
0
•
No captions

Losing at the start only makes winning later sweeter | Trade with Purab #motivation #shorts
0
1 year ago
No captions

Trust the process. God knows best | Trade with Purab #shorts #god
1 year ago
•
0
•
No captions

Trust the process. God knows best | Trade with Purab #shorts #god
0
1 year ago
No captions

Kill the past until past will kill you | Trade with Purab #motivation #shortsfeed
1 year ago
•
0
•
No captions

Kill the past until past will kill you | Trade with Purab #motivation #shortsfeed
0
1 year ago
No captions

Profit hone hi lagta hai ki logo ki nazar lag jati hai | Trade with Purab #tradingmemes #shortsvideo
1 year ago
•
0
•
No captions

Profit hone hi lagta hai ki logo ki nazar lag jati hai | Trade with Purab #tradingmemes #shortsvideo
0
1 year ago
No captions

From Gym Trainer to Trading Expert : This Journey is Amazing! | Trade with Purab
1 year ago
•
0
•
No captions

From Gym Trainer to Trading Expert : This Journey is Amazing! | Trade with Purab
0
1 year ago
No captions

From a rough month to rewarding trades | Trading with Purab #trading #shorts
1 year ago
•
0
•
No captions

From a rough month to rewarding trades | Trading with Purab #trading #shorts
0
1 year ago
No captions

When me and my friend profits in trading | Trading Videos #funny #traders #shorts
1 year ago
•
0
•
No captions

When me and my friend profits in trading | Trading Videos #funny #traders #shorts
0
1 year ago
No captions

Proud Parents- Emotional Moment 🥹 | Trade with Purab
1 year ago
•
0
•
No captions

Proud Parents- Emotional Moment 🥹 | Trade with Purab
0
1 year ago
No captions