A RSI Divergence STRATEGY (That Actually Works...)

Published: 2020-05-12
Status:
Available
|
Analyzed
Published: 2020-05-12
Status:
Available
|
Analyzed
Predictions from this Video
Incorrect: 0
Prediction
Topic
Status
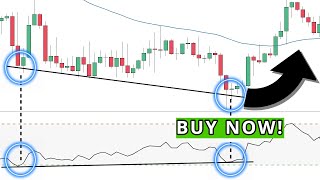
A strategy using RSI divergence, higher lows on RSI, lower lows on price, a V formation, a double bottom, and a green hammer candle is presented as a signal for potential reversal.
"we have RSI divergence here on our RSI higher lows lower lows on price and at this point we've pushed up we pushed back down creating our V formation we've created a double bottom and the double bottom candle itself is a green hammer candle this is a great signal for me personally would be a great signal"
Pending
A rules-based trading strategy involves looking for RSI divergence after an oversold condition, followed by a double bottom and a green candle kicker.
"we're gonna look for our side of urgent's after being oversold obviously when you're looking for the divergence we have to see that we're looking for RSI divergence that ends up having a double bottom with a green candle kicker after the double bottom"
Pending
A system-based trading strategy requires the market to be at previous resistance and show RSI divergence.
"I need the market to be at previous resistance I need the market to show me our side of her just to give you a very simple example of this I'm gonna go to the dollar yen chart"
Pending
A discretionary trading strategy involves a point system where RSI divergence, wicks off the 50 (on a 4-hour chart), and a breakout pattern contribute to trade entry.
"I got more than five points with it with we have wicks coming off the 50 that's one we had overbought our side we had RSI divergence and the breakout pattern for me counted is two so we had that breakout pattern the big push down you could have called one but that would be a discretionary style trading with divergence"
Pending
A discretionary trading approach for a specific trade involves RSI divergence, lower highs on RSI, higher highs on price, a significant downward move, and a potential breakout trade.
"I'm looking for RSI divergence lower highs on the RSI higher highs on price I'm looking for a big move down followed by a potential breakout trade"
Pending
In discretionary trading, an entry criteria for a potential reversal, even with RSI divergence and new higher highs in price, is not met until further conditions are satisfied.
"my entry criteria has not been met my entry criteria is something I'm gonna discuss with you whenever we actually entered the trade so let's keep going let's keep moving price so and remember this is the discretionary way of trading as the market pushes up we get a new higher high yet again"
Pending
Divergence occurs when the price action makes new higher highs while the indicator (RSI in this case) makes lower highs.
"this is what we call divergence is the indicator moving contrary or opposite to the way price itself is the candlesticks price action itself is making new higher highs here but our indicator is making lower highs with that being the case we have divergence"
Pending
A new high in price is not confirmed for divergence analysis until it becomes a 'swing high', indicated by a subsequent pullback, to avoid false signals from continuous upward momentum.
"in order to classify this as a new high we need to wait until it turns into a swing high and have rules for that but let me tell you the reason first what if all we saw was green candles and green candles kept pushing this market up and it ended up not being RSI divergence"
Pending
When looking for a potential second high for divergence analysis, the focus is on confirming the first high as a 'swing high' by observing a two-candle pullback (two red candles).
"in order to look for this second high right now where price is I wouldn't even be looking at my RSI indicator not at all I want to see this high as a swing high and in order to do that for my rolls I need this swing high to be followed by two red candles"
Pending
The video will now explain how to identify divergence on currency pairs.
"we have divergence so now you know what divergence is let's move on to the second part which is how can we spot divergence on a currency pair"
Pending
Divergence is a reversal indication and is most effective in trending markets; it does not work well in consolidation.
"divergence is an indication so with that being the case with it being a reversal indication I need to make sure that the market is trending up or down before I use it reversal does not work well and consolidation you want to make sure the market can actually reverse so for that reason make sure it's a trending market"
Pending
To identify potential divergence, the speaker ensures the RSI is either overbought or oversold before looking for divergence signals.
"the way I do that is by making sure the RSI is either overbought or oversold before I look for divergence"
Pending
The first rule for spotting divergence is that the market must be exiting an overbought or oversold condition.
"rule number one in order to spot divergence we need the market to be coming out of an overbought situation or an oversold situation"
Pending
When looking for a potential second high for divergence analysis, the focus is on confirming the first high as a 'swing high' by observing a two-candle pullback (two red candles).
"in order to look for this second high right now where price is I wouldn't even be looking at my RSI indicator not at all I want to see this high as a swing high and in order to do that for my rolls I need this swing high to be followed by two red candles"
Pending
Once divergence is spotted, the next step is to learn how to use this information to find better trading opportunities.
"so at this point I can see that we have divergence and now that you know how to spot divergence in a market what I'm going to do is teach you how we actually use this information to get into better trading opportunities"
Pending
To spot divergence for selling, the RSI must be overbought. After this, a single higher high is not enough; it must be a swing high, identified by a two-candle pullback.
"rule number one I want to make sure the RSI is overbought before I start looking for divergence to the selling direction oversold if we're going the opposite direction pretty obvious but after rule number one's in place I don't want to just trade based on one candlestick making a higher high I want to make sure that's a swing high in order to do that is me looking for or the way I identify that is with this two candle pullback"
Pending
Divergence occurs when price action forms higher highs while the indicator forms lower highs.
"this is what we call divergence is the indicator moving contrary or opposite to the way price itself is the candlesticks price action itself is making new higher highs here but our indicator is making lower highs with that being the case we have divergence"
Pending
Divergence signals that the current price and trend might be weakening and could lead to a reversal.
"the use of divergence says that it warns that the current price and trend may be weakening and in some cases may lead to price changing direction"
Pending
On the example chart (Aussie Yen 15-minute), price made a higher high, but the RSI indicator made a lower high, indicating divergence.
"we have a high here we then have a new higher high on the oscillator on this case we're using the RSI indicator this is the indicator we'll use for the entirety of this video and it's my favorite indicator to use for divergence on the RSI indicator you can see that we have a lower high"
Pending