The Only RSI Indicator Trading Video You Will Ever Need... (Beginners Guide)

Published: 2021-09-30
Status:
Available
|
Analyzed
Published: 2021-09-30
Status:
Available
|
Analyzed
Predictions from this Video
Incorrect: 0
Prediction
Topic
Status
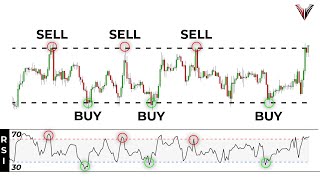
A bullish reversal strategy involves seeing the RSI go below 30 on the 4-hour chart, then looking for a double bottom chart pattern on the 1-hour chart. Entry is confirmed by a convincing green candle, with a stop loss below the double bottom and targets at previous structure levels.
"we're going to start off with conditions we are on a four hour chart as i said we're going to incorporate multiple time frames we're going to be looking at the four hour chart and you can use any time frame for this it does not matter if it's the four hour one hour 15 minute or five minute you're always just going to drop down one time frame so i'm going from the four hour to the one hour if you were looking at the one hour for this condition you would go down to the 15 minute for your entry if you're looking at the 15 minute you go down to the five minute so on and so forth so on the four hour chart what we're looking for is the rsi indicator to go below 30. or in other words the rsi indicator to go to oversold so we want to see when that happens let's go ahead and take a look here it happens right here on the very next candle as you can see at this point the rsi has now went below 30. that is our first condition the next thing we want to do is drop down to the one hour chart so after we see the four hour rsi go oversold we're gonna drop down to the one-hour chart here on the one-hour chart after seeing our higher time frame go oversold we want to see a chart pattern and if you don't have clear definitions for chart patterns and if you don't know how to identify them i will leave a video right up here in the top right hand corner i did about a month ago that talks about double bottoms double tops head and shoulder and inverse head and shoulder patterns which are the chart patterns we're going to be using for this strategy so if you're unfamiliar with them just click that link go to that video and check it out so now that we know we're oversold on our four-hour chart again we're just looking for price to create a double bottom here we have our first bottom right now the way we're looking at this is price has pulled down created one bottom and a neckline next up for a double bottom we want to see price come re-test this line right here that means we have a valid double bottom let's see what happens with price eventually we come down and retest this actual spot so this is condition number two for our chart we need to see oversold for condition number one condition number two we go down to the one hour chart and look for a price pattern or a chart pattern in this case a double bottom now what is going to be our entry these are all the conditions we need met it's what i just described now we're moving from conditions to entries what's the entry going to be the entry is going to be buying pressure for buying pressure i need a convincing green candle so let's keep pushing forward right here we have a doji right here we have a small green candle doesn't look quite convincing yet right so we need to see a bigger green candle so that we know it's convincing enough to show us buying pressure this would be a great example of this and if you want to set a rule for this pick a candle that closes above the previous candle that would be a convincing green candle right so for our entry we have a convincing green candle for our conditions we have four hour oversold we have one hour double bottom now we have our entry what do we do after we see our entry we go ahead and place our order it would look something like this buy at the close of that candle or the open of the next scandal stop loss always for me goes below my double bottom the lowest low of that double bottom targets you can go back up to around previous structure right here so with that being the case now we have our trade setup and we have actually gotten into the market we've pressed the buy button and let's see how this would have played out as you can see quite easily pushing up to hit targets"
Pending
A bearish reversal strategy involves seeing the RSI go above 70 on the 4-hour chart, then looking for a double top chart pattern on the 1-hour chart. Entry is confirmed by a convincing red candle, with a stop loss above the highest swing high of the double top and targets at previous structure levels.
"for the bearish version of this strategy we are still on the four hour chart now and what are we looking for on the four hour chart what's our condition well for a bearish version of this we want to see the rsi indicator go above 70 and show us an overbought scenario here on the four hour chart so let's click ahead here with the market and see what happens do we get overbought not yet are we overbought now well an easy way is to look right over here whenever i hover over the price and if it's above 70 that means the rsi is above 70. so obviously at this point we're at 70.88 we can now do what our condition number one is met we have overbought on a four-hour chart we can now drop down to the one-hour chart here on the one-hour chart what are we looking for we're waiting for either a double top or some type of other chart pattern like a head and shoulders pattern so if we go ahead and click play here you will see that eventually this would not be a double top by the way this is not enough in between we only have one candle in between before that next stop do not count that as a double top you'll learn more about that again if you go over here to the chart pattern video we did about a month ago but let's go ahead and click play as you can see we're moving around a bit and now what has happened at this point we have one top the neckline of the double top and then pushing up we have another top right here this double top qualifies as a valid double top for that reason with that being the case now what are we waiting on we have condition number one met with four hour being overbought we have condition number two a valid double top we're now looking for our entry which is going to be a convincing red candle so let's see if we get that convincing red candle yes we do we get a red candle here that closes below the last candle that's pretty convincing to me so what we would be doing is placing an order there having a stop loss above our previous swing high because it's higher than this swing eye so we want to make sure the stop-loss is above the highest swing high of the double top targets could go down at previous structure which i'm seeing as this level right here and there we go this is our trade setup and with that being the case we'll go ahead and click play we got pretty close to the stop loss but then the market did in fact turn around push down and hit our target"
Pending
A bullish trend continuation strategy uses a 7-period RSI. Conditions are: price above the 50-period moving average, the 7-period RSI going above 70 (overbought), and a pullback to a major level of structure that has been previously broken and tested multiple times. Entry is signaled by buying pressure (e.g., a long-wicked candle) at this structure level, ideally also coinciding with the 50-period moving average acting as support. Stop loss is placed below the swing low of the pullback, and targets can be set at previous structure levels or a 1.4:1 reward-to-risk ratio.
"so here's an example of how i like to use the rsi for trend continuation if i double click on the rsi you'll see that we are set to seven right and right now we are involved in this live trade that i'll take you through in just a second but let's go ahead and start from the initial break of the moving average down here so initially we break above the 50 period moving average do we go into an overbought scenario right here yes we do so with that being the case what am i waiting on i would be waiting for a pullback into the previous level of structure that was broken which is right here so as we pushed up moved into over ball this is the most recent level we broke if we broke that level most recently then i'm looking in this area for a pullback and buying pressure if i get that buying pressure that's where i want to look to go long considering that buying momentum has come into the market the reason i know this is because the seven period rsi has went above 70 here on our rsi indicator then after that i want to see this pullback i want the pullback to come to the recent level of structure that was broken and i want to buy when i see buying pressure this is just an example of how i would use it for trend continuation so as we continue higher you can see that we consistently repeat this process we go into another overbought scenario we then pull back we don't get to a level of structure this being the most recent level of structure this time so we actually went past it without actually getting any kind of entry reason we then push up we break above our level of resistance we get to pull back into that level of resistance and a big green candle but this candle is a little bit too big i wouldn't i wouldn't feel comfortable entering right there i need to have some room to the upside whenever i actually enter on a trade like this we have another scenario where price pushes up and we get a new higher high we go into over ball yet again we pull back but again this huge green candle does not give me an opportunity to enter into the market then we push up to this high was this high an overbought scenario yes it was this high also goes above 70 on the rsi with that being the case i know i'm going to be looking for the level of resistance that was just broken the level of structure most recently broken and in this case we don't just have a level that was tested once but we have a level that was tested multiple times that adds even more confluence to this area and shows me that this is a level i want to look for a possible buy trade with that being the case i wait to see buying pressure so as we push down to this area we get a strong wick rejection from this area along with this rejection coming straight off of the 50 period moving average which often time acts as a level of support for markets so with those factors coming together and throwing everything together here we have a good opportunity at least based on the way i trade trend continuation with the rsi we have a good opportunity to go long after seeing that buying pressure we are live in this trade now i'll let you guys know how it plays out this is actually a day trading time frame just to show you guys how to use this on multiple time frames for the 15-minute chart it's the same exact way i would use it on the 4-hour chart it doesn't change at all so with that being the case we'll see how this trade plays out and i'll keep you guys updated"
Pending
A bearish trend continuation strategy uses a 7-period RSI. Conditions are: price below the 50-period moving average, the 7-period RSI going below 30 (oversold), and a pullback to the latest level of structure that was broken. Entry is signaled by selling pressure (e.g., a convincing red candle) at this structure level. Stop loss is placed above the swing high, and targets are at previous structure levels. The strategy can also be enhanced by looking for RSI divergence in oversold territory.
"here's the trade on the dollar canada we were just looking at as you can see we are still actually involved in this trade right now and i'm actually about to exit i want to go over why i'm deciding to exit this trade and then we'll do c e s t for this trade and the strategy that uses the rsi indicator with a faster setting in order to take advantage of trend continuation trades so first off why am i deciding to exit this trade now well it's because only 14 period rsi we have what we call rsi divergence and for those of you who are divergence traders the only reason i haven't talked about that yet is because these two strategies do not use it so don't worry i am going to get to that a little bit later on in the video including right now i like to use this for taking targets so whenever i see something like rsi divergence and selling pressure that's when i want to start looking at taking my position off so let me define rsi divergence really quickly it is very simple it is when the rsi indicator has a high and then a lower high while price has a high and then a higher high for rsi divergence when we're looking at overbought it would be the opposite for oversold scenarios but this being the case and seeing this massive amount of selling pressure with this big red candle including the fact that we're getting closer to 5 p.m and i don't want to hold this trade for another night means i'm going to go ahead and close this position so there we go we've exited the position now let's take the chart back using market replay and talk about the full rule set the cest for this trend continuation trading strategy so first off we have our rsi length set to seven the reason for this is because i want a faster moving rsi indicator to show me the most recent momentum of the market because i'm trading pullbacks based on that most recent momentum so with that being the case our first condition for this strategy is that i need a seven period rsi to go overbought at my swing high does that condition get met yes it does my second condition is that i must have a pullback into a major level of structure into the recent level of structure that price broke and if you want to add even more confluence to this you want to have this level be a level that has been tested multiple times so if those two factors are coming together that is going to be condition number one and two so we have condition number one and two met at the time of this long wicked candle right here with that being the case i have condition one and two met i now need to look for an entry my entry is buying pressure coming out of my level of structure and this trade had even more significance because that buying pressure was coming off of the 50 period moving average so so hopefully you're getting the point now that the rsi indicator by itself doesn't mean much but when we can add a lot of different confluence with it like candlestick patterns like levels of structure that have been tested multiple times like using it for trend continuation by shortening the length of the rsi like trading it only when we're in the correct trend when we're using the short period rsi which is something i forgot to mention in conditions for conditions we also need to be above the 50 period moving average so keep that in mind as well our entry candle long-wicked candle showing me buying pressure coming out of that level of structure and we've already seen the results of this trade but let's go ahead and talk about stops and targets before i click play stops and targets are quite simple for stop loss i just went below my entry candle because in this case your entry candle may or may not be the swing low so i always try to go below the swing low of this pullback that came from the rsi being above 70. for my targets i normally go with either previous structure or whenever i see rsi divergence you can pick however you would like to take targets for me it's more of a subjective term targets are very subjective for me that's why it's so hard for me to tell you some objective rules but initially i like to look for a 1.4 to 1 or structure levels in this case i let the market go a little bit further but that was the whole trade setup that was our reason for pressing the buy button was seeing our long-wicked candle come out of the structure level after all of those conditions were met and as you've already seen this trade ended up working out very well again i will say this this does not happen all the time this has losses it has a lot of losses just like any other strategy but over a long period of time it tends to make money for me in the way that i traded now let's take a look at a bearish example of this strategy on the pound yen now we're taking a look at the pound yen and we have another example here of the train continuation rsi strategy we're going to go ahead and place our order and we have a stop loss just above the swing high with a target that's going to be close to our next structure level let's see right about there in that area and with that being the case we're gonna go ahead and create the order we're gonna use a one percent risk on this trade and it needs to be a market order not a limit order and let's go ahead and sell all right so now we are in this position i'll keep you guys updated on how it plays out but for now let's go ahead and take a look at the rules for the bearish version of this strategy we ended up getting some really good movement out of the pound yen to the downside last night which ended up hitting our targets but now let's go through cest for the v for the bearish excuse me version of this strategy so conditions what do we need first off i didn't mention this on the bullish version but we need price to be in trend based on the 50 period moving average is priced below the 50 period moving average yes it is we then need to see the rsi 7 period go below 30 because that's showing us that at least in the short term we have momentum to the downside we can tell that this this is momentum though right you can tell by this waterfall of red candles we have momentum to the downside but as i said earlier this gives us a objective way of saying that so that we're never subjective with our strategies which is how to create roles based strategies condition one under the 50 period moving average condition two under 30 on the seven period moving average condition number three a pullback into the latest level of structure that was broken after those three conditions are met conditions times three we now are ready to start looking for our entry for our entry we want to see selling pressure at this area selling pressure is our entry so now we have conditions and entry again the stop loss above the swing high target down at previous structure and after hearing that twice hopefully it made this strategy extremely simple it really is not a very complicated strategy whatsoever and what we'll talk about again is a little bit of divergence so here just to explain divergence really quickly because i have not hit on it yet other than just now in the previous section of the video what we have for divergence in the oversold territory is a low that matches a low in price we then have a lower low in price and a higher low on the rsi indicator this is an extra confluence an added indication that we could see a reversal from this point if you ever want to add a little more confluence to an rsi being oversawed or oversold or overbought then be sure to look for divergence in the rsi indicator as i always say it is super important for you not to go and just randomly start trading this because i showed it to you as a strategy trading takes a lot of work if you want to lose weight or gain muscle you can't just go to the gym and watch everybody at the gym you have to actually put in work trading is the same way you're not gonna be able to watch a youtube video and then go be profitable so your next step is to back test these strategies if you're going to use them at least now you have an idea of how the rsi works and a couple of examples of how to create strategies with them obviously there's an unlimited amount of ways to use the rsi indicator these are just a couple of ways that i like to use it what i do want to go over right now though is a very simple way to do the back testing on this strategy it's a single time frame strategy so it's super easy to backtest this strategy you don't need an explanation take all the rules that are c-e-s-t look through historic data see how many times it won versus how many times it lost and if that comes up with a positive expectancy then you have what you need to take your next steps which we'll talk about later but a very easy way to test the multiple time frame strategy that we talked about is to go to your higher time frame and then get your 14 period rsi on the four hour chart which is the chart that we're using and all you have to do at this point is circle everywhere that went oversold or overbought on this four hour chart you don't have to actually circle the rsi i'm just showing you that price did go overbought in those areas so here we have everywhere that price went oversold or overbought and we're just going to circle every place that that happened once you have that done you can drop down to your one hour chart and you can look for double bottoms and head and shoulder patterns in those circles super simple way to back test that strategy so now you have no excuses for not back testing it this strategy is just as easy as the other one to back test whenever you take the steps of just circling every area on the larger time frame where price went overbought or oversold"
Pending
The speaker outlines a path to becoming a consistently profitable trader. This involves learning market basics, technical analysis, learning/building strategies, backtesting, understanding risk management and trading psychology, building a trading plan, and then moving to live trading. They offer a free basic course at www.ttc4xcourse.com and a more advanced, mentored program called the EAP Training Program at www.eaptrainingprogram.com, which includes a 60-day money-back guarantee.
"so right now your job is to get through with all these steps if you need a little bit of help with that we actually have a video course that's absolutely free that will take you through a majority of this information at least get you accustomed to it it may not be everything you need but it's a completely free basic scores and it will give you a good foundation of each of these eight steps that you can find at www.ttc4xcourse.com it's also on the screen and linked in the description if you're someone who's ready for some more advanced training and to be personally mentored by me then we also have a little space available in our flagship program called the eap training program in that program you will get a course that will take you through each of these and also we have other strategies that we trade in the course we have training on risk management and trading psychology we have three to five emails of trades that i'm actually taking by the way that are based on the strategies you're learning that i send out three to five times a week we have a video every monday where i show you my plan for the week and what i'm looking to trade that and much much more we pretty much teach you how to build a full trading plan in that course and you have priority email meaning any question you have i will be answering those questions personally so if you're interested in that it is www.eaptrainingprogram.com it's on the screen and in the description and this program also comes with a 60-day money-back guarantee so if for any reason you feel like the program is not for you within the first 60 days just email me and i'll have my support staff send you a refund as soon as possible"
Pending