ULTIMATE Candlestick Patterns Trading Strategy (Two Candlestick Patterns That Saved My Trading...)

Published: 2022-09-23
Status:
Available
|
Analyzed
Published: 2022-09-23
Status:
Available
|
Analyzed
Predictions from this Video
Incorrect: 0
Prediction
Topic
Status
The presented strategy is expected to help new traders become profitable.
"I think can jump start your profitable trading career"
Pending
The presented strategy is expected to help new traders become profitable.
"I think can help kick-start your profitable Trading career"
Pending
The CEST model is recommended for building rule-based trading strategies.
"if you plan to build strategies use the CEST model in order to ensure that your strategy is rules based"
Pending
Trading strategies experience periods of high and low profitability.
"strategies tend to have times when they perform really well and make a lot of profit and they tend to have times when they perform not so well"
Pending
Successful traders can navigate periods when their strategies underperform.
"the winning Traders have the ability to make it through those periods of drawdown when strategies are performing less well"
Pending
Profitable trading results in an equity curve with peaks and valleys, not a linear progression.
"we cannot expect our trading to just be a straight line from point A to point B it's going to be more like mountains and valleys that have a slope to the upside if we're trading a profitable strategy"
Pending
The primary reasons for trading failure are lack of a profitable strategy, inadequate risk management, or poor trading psychology and discipline.
"95 percent of people fail is because they're lacking either a strategy that makes money over time a risk management plan that keeps them comfortable and emotionless during their trades or a knowledge of trading psychology and the ability to be disciplined to that strategy and that risk management plan"
Pending
The TTC 4X University offers a comprehensive, university-style course for traders of all levels.
"if you're ready to take that next step and you want to learn from an organized University style course that'll teach you everything from the basics to extremely Advanced strategies then we do have some space available in the TTC 4X University"
Pending
TTC 4X University students will receive 3-5 weekly email analyses of trades taken by the instructor.
"with the TTC Forex University you'll also be receiving three to five email analysis per week which are trades I'm actually taking based on the strategies you're learning in the course"
Pending
A weekly 'Pro Trader Report' and 'Best Setups' video will be provided, detailing currency pairs and structure levels of interest.
"you'll be receiving the Pro Trader report at a best setups video each and every Monday talking about the pairs and structure levels I'm paying attention to personally for possible trades"
Pending
Personal email coaching support will be available from the instructor for trading-related questions.
"you also receive email coaching support so it'll be me personally answering any emails you have or any questions that you have rather about trading in general or about the course"
Pending
The TTC 4X University includes a risk-free money-back guarantee.
"on top of all that the university also comes with a risk-free money back guarantee"
Pending
Two specific candlestick patterns are responsible for 90% of the speaker's trading profits.
"there were two Candlestick patterns that stood out Above the Rest and that these two Candlestick patterns were accounting for ninety percent of the profits I was making in my trading"
Pending
Two specific candlestick patterns are responsible for 90% of the speaker's trading profits.
"I realized there were two Candlestick patterns that stood out Above the Rest and that these two Candlestick patterns were accounting for ninety percent of the profits I was making in my trading."
Pending
The speaker continues to exclusively use two specific candlestick patterns in their trading.
"these two Candlestick patterns performed so well that they're still the only two Candlestick patterns I use in my trading today"
Pending
The speaker exclusively uses two specific candlestick patterns in their current trading strategy.
"these two Candlestick patterns performed so well that they're still the only two Candlestick patterns I use in my trading today"
Pending
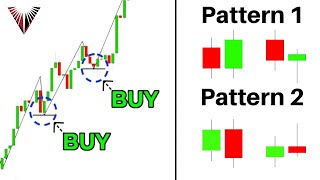
The speaker's two preferred candlestick patterns are the bullish/bearish engulfing and the hammer/shooting star.
"my two favorite Candlestick patterns are the bullish and bearish engulfing pattern and the hammer slash shooting star pattern"
Pending
A bullish engulfing pattern is defined as a red candle followed by a green candle with a larger body.
"for a bullish engulfing pattern it's super simple we're looking for a red candle followed by a green candle in which the green candle has a larger body than the red candle"
Pending
The speaker's two favorite candlestick patterns are bullish/bearish engulfing and hammer/shooting star.
"essentially my two favorite Candlestick patterns are the bullish and bearish engulfing pattern and the hammer slash shooting star pattern"
Pending
A bearish engulfing pattern is defined as a green candle followed by a red candle with a larger body.
"for a bearish engulfing pattern we're looking at exactly the opposite we would look for a green candle followed by a red candle that has a larger body than the green candle"
Pending
The speaker will outline a systematic trading strategy using two specific candlestick patterns designed to improve profitability.
"I'm going to explain a full systematic strategy that utilizes these two Candlestick patterns and that I think can jump start your profitable trading career"
Pending
A hammer candle is identified when its entire body is above the 38.2% Fibonacci retracement level.
"I want to ensure that the entire body of the candle is above the 38.2 retracement as long as that is met and as long as that is true I have a valid Hammer candle"
Pending
The trading strategy being presented is a trend continuation strategy.
"this strategy specifically is going to be a trained continuation strategy"
Pending
A shooting star candle is identified when its entire body is below the 38.2% Fibonacci retracement level.
"for a shooting star it's exactly the opposite I'm pulling a Fibonacci retracement from the high of the candle down to the low of the candle as long as the entire body of the candle is below the 38.2 percent retracement I have what I consider a valid shooting star"
Pending
An uptrend is identified when the 20 Exponential Moving Average (EMA) is above the 50 EMA, indicating opportunities for buying.
"for Trend we're gonna be using the 20 EMA and the 50 EMA when the 20 EMA which is my red line is above the 50 EMA which is my blue line we're going to consider that an uptrend and be looking for buying opportunities"
Pending
The described trading strategy is a trend continuation strategy.
"this strategy specifically is going to be a trained continuation strategy"
Pending
The stochastic indicator will be used to identify extreme overbought or oversold conditions as an area of value.
"the second area of value we're going to be using is the stochastics indicator and we're going to be looking for extremes on the stochastics indicator"
Pending
An uptrend is identified when the 20 EMA is above the 50 EMA, signaling a bias for buying opportunities.
"for Trend we're gonna be using the 20 EMA and the 50 EMA when the 20 EMA which is my red line is above the 50 EMA which is my blue line we're going to consider that an uptrend and be looking for buying opportunities"
Pending
Overbought conditions (stochastics above 80) signal potential sell trades, while oversold conditions (stochastics below 20) signal potential buy trades.
"an extreme for the stochastic indicator can be seen at the 20 line and at the 80 line if this blue line is above the 80 line then we're in an extreme over ball area if the Blue Line's below the 20 on the stochastics indicator we're in oversold territory will be looking for we'll be looking for buy trades and oversold and sell trades in overall"
Pending
Areas of value in the strategy include moving averages (acting as support/resistance), stochastic extremes (overbought > 80, oversold < 20), and support/resistance levels within 100 candles.
"we're also going to be combining Trend with areas of value... the moving averages themselves which can oftentimes act as support or resistance... the stochastics indicator and we're going to be looking for extremes on the stochastics indicator... if this blue line is above the 80 line then we're in an extreme over ball area if the Blue Line's below the 20 on the stochastics indicator we're in oversold territory... support or resistance within 100 candles looking left"
Pending
A valid trading setup requires at least two out of the three identified areas of value to align with the current trend.
"we need at least two out of three of these to occur so we're gonna be looking for at least two out of three of our areas of value to occur while price is also in Trend"
Pending
Previous support or resistance levels within the last 100 candles are considered an area of value.
"the third area of value that we can look for is support or resistance within 100 candles looking left"
Pending
Stop losses for trades are set at one times the Average True Range (ATR) indicator.
"stops to keep things simple are going to be One X ATR"
Pending
A trading setup requires at least two out of three identified areas of value to be present while the price is also in an established trend.
"we need at least two out of three of these to occur so we're gonna be looking for at least two out of three of our areas of value to occur while price is also in Trend defined by our 20 and 50 EMA"
Pending
Trade targets are set to achieve a 1.4 to 1 reward-to-risk ratio based on the stop loss.
"targets are going to be a 1.4 to 1 reward to risk ratio compared to our stop loss"
Pending
Stop losses will be set at one times the Average True Range (ATR) to account for market volatility.
"stops to keep things simple are going to be One X ATR the ATR indicator is right up here it can be found on most trading platforms and it measures the volatility of the market by giving you the ad average movement of the last 14 candles"
Pending
The speaker's trading strategy development model is called CEST, representing Conditions (Trend, Areas of Value), Entries, Stops, and Targets.
"C stands for the conditions I need to see before I look for a trade conditions would be things like Trend and areas of value E obviously stands for entries that I can take... S stands for stops... T stands for targets"
Pending
Target profit levels will be set at a 1.4:1 reward-to-risk ratio based on the stop loss placement.
"targets are going to be a 1.4 to 1 reward to risk ratio compared to our stop loss"
Pending
The first step in a Dollar Yen trade example is to confirm an uptrend using the 20 EMA above the 50 EMA.
"here on the chart starting off with what do we need to do we need to find the trend of the market it's very obvious when we're using the 20 and 50 EMA as long as a 20 EMA is above the 50 EMA we're considering that an uptrend and we're looking for buying opportunities"
Pending
The first step ('C' in CEST) of the trading strategy involves identifying market conditions such as trend and areas of value.
"C stands for the conditions I need to see before I look for a trade conditions would be things like Trend and areas of value"
Pending
In the Dollar Yen example, two areas of value are identified: the 50 EMA and the stochastic indicator being in oversold territory (below 20).
"we're pointing out two out of three of these areas of value... price is... coming into an area of value well the 50 EMA can be an area of value... our stochastics indicator at an extreme... the blue line did in fact go below our small dotted line which is the 20 mark on our stochastics"
Pending
The second step ('E' in CEST) involves having clear, predefined rules for executing trades (entries).
"e obviously stands for entries that I can take why am I actually going to press the button I don't want to be confused after seeing my conditions met on why I'm actually going to place the trade I need exact rules for why I press the buy button or the sell button"
Pending
A valid hammer candle entry is confirmed in the Dollar Yen example as its body is above the 38.2% retracement.
"we actually also have a valid Hammer candle according to our rules our rules are that a hammer candle needs to have the body of the candle above the 38.2 retracement"
Pending
The third step ('S' in CEST) requires pre-determining the exact placement of stop-loss orders before entering a trade.
"s stands for stops I need to know exactly where I'm going to be placing my stop before I enter the trade"
Pending
The stop loss for the Dollar Yen trade is calculated by taking the current ATR (59 pips) and subtracting it from the entry candle's low (50), resulting in a stop loss at 109.
"the ATR indicator is right up here and right now you can see that the ATR is 59... we want to go that 59 Pips below the wick of this candle so we have 50 down to it that means 109 is going to be our stop loss"
Pending
The fourth step ('T' in CEST) involves setting specific targets for exiting the market when a trade is profitable.
"T stands for targets I need to know an area that I'm looking to get out of the market if I'm right"
Pending
In the USD/JPY example, the trend is confirmed as bullish because the 20 EMA is above the 50 EMA.
"here on the chart starting off with what do we need to do we need to find the trend of the market it's very obvious when we're using the 20 and 50 EMA as long as a 20 EMA is above the 50 EMA we're considering that an uptrend and we're looking for buying opportunities so do we have that here here yes we do we have the red line above the Blue Line"
Pending
The target for the Dollar Yen trade is set at a 1.4:1 reward-to-risk ratio relative to the calculated stop loss.
"for our step number five that's going to be finding the targets the targets are a 1.4 to 1 reward risk ratio based on that stop loss"
Pending
In the USD/JPY example, two areas of value are confirmed: the 50 EMA and oversold conditions on the stochastics indicator (below 20).
"we're pointing out two out of three of these areas of value that's what we need to see so right now where price is is it coming into an area of value well the 50 EMA can be an area of value so the answer to that question is yes we have one area value the next question we have to ask is is our stochastics indicator at an extreme in this case if we look down here you can see that a blue line did in fact go below our small dotted line which is the 20 mark on our stochastics"
Pending
The second Forex trade example confirms a downtrend because the 20 EMA is below the 50 EMA, indicating a focus on sell trades.
"step one find the trend of the market is the 20 below or above the 50 20 is the red line 50 is the Blue Line we're below therefore we're looking for a downtrend or we're looking for sell trades"
Pending
The USD/JPY trade setup is completed with a valid Hammer candlestick pattern as the entry signal.
"we not only have our two areas of value completed but if we look at step three which is to find an entry I've already pointed this out we actually also have a valid Hammer candle according to our rules"
Pending
In the second example, two areas of value are identified: the 50 EMA and a previous support level within 100 candles to the left.
"are we against the 50 EMA again here yes we are... we have our previous level of structure support that was broken and this level of support is if I bring out my measuring tool within 100 candles"
Pending
In the USD/JPY example, the stop loss is set 59 pips below the entry candle's wick, based on the ATR value.
"our stops are going to be one times the ATR indicator in case that's not clear the ATR indicator is right up here and right now you can see that the ATR is 59... we want to go that 59 Pips below the wick of this candle so we have 50 down to it that means 109 is going to be our stop loss"
Pending
A shooting star candle is identified as the entry signal for the second Forex trade example.
"we have ourselves a shooting star candle which is our entry"
Pending
The target for the USD/JPY trade is a 1.4:1 reward-to-risk ratio.
"for our step number five that's going to be finding the targets the targets are a 1.4 to 1 reward risk ratio based on that stop loss"
Pending
The stop loss for the second example is calculated by adding the ATR (21 pips) to the entry candle's low (12), resulting in a stop loss at 33.
"the ATR is 21 Pips 12 plus 21 is 33"
Pending
In this trading example, the trend is confirmed as bearish because the 20 EMA is below the 50 EMA.
"step one find the trend of the market is the 20 below or above the 50 20 is the red line 50 is the Blue Line we're below therefore we're looking for a downtrend or we're looking for sell trades"
Pending
The target for the second example is set at a 1.4:1 reward-to-risk ratio.
"we're shooting for a 1.4 for these examples"
Pending
The 50 EMA is acting as an area of value in this trade setup, as the entry candle is touching it.
"are we against the 50 EMA again here yes we are we're right up against that 50 EMA and as long as the candle that is the entry candle is still touching the 50 EMA then I count that 50 EMA as an area of value"
Pending
The third example combines multiple areas of value: the 20 EMA, previous resistance within 100 candles, the 50 EMA, and an extreme stochastic reading.
"we come into not only the 20 EMA are red line but also coming into that previous area of resistance that is within 100 candles... this is a level of structure paired with the 50 EMA which is also paired with an extreme stochastic"
Pending
A prior support level, broken and now acting as resistance, within 100 candles to the left, is identified as another area of value.
"the next area of value which is a support or resistance level within 100 candles looking left so in this case what I want you to be able to spot is right here we have our previous level of structure support that was broken"
Pending
A bearish engulfing bar signals the entry for the third Forex trade example.
"and here we have that entry which is a bearish engulfing bar"
Pending
The identified support/resistance level is within 100 candles (46 bars left), confirming it as a valid area of value alongside the 50 EMA.
"you can see that that is 46 bars to the left which means it's less than 100 bars right which means we have area value one with the 50 EMA and we have area value 3 with a support or resistance level looking left within 100 candles"
Pending
The combination of multiple confluent areas of value with a clear entry signal is referred to as the 'perfect setup'.
"this is what we would call the absolutely perfect setup for this trading strategy"
Pending
A shooting star candlestick pattern has formed, serving as the entry signal for this trade.
"we have ourselves a shooting star candle which is our entry"
Pending
Trading strategies naturally experience periods of high performance and profitability, interspersed with periods of underperformance.
"strategies tend to have times when they perform really well and make a lot of profit and they tend to have times when they perform not so well"
Pending
The stop loss is set at 33 (12 + 21 pips ATR) and the target is a 1.4:1 reward-to-risk ratio.
"the ATR is 21 Pips 12 plus 21 is 33 and we're shooting for a 1.4 for these examples"
Pending
In this example, the trend is confirmed as bullish because the 20 EMA is above the 50 EMA.
"step number one is that we need to see price in an uptrend price is it an uptrend win the 20 EMA's above the 50 EMA"
Pending
Successful traders can endure periods of drawdown by remaining steadfast when their strategies are not performing optimally.
"winning Traders have the ability to make it through those periods of drawdown when strategies are performing less well"
Pending
Potential areas of value during a pullback include the 20 EMA, 50 EMA, stochastic extremes, and prior structure levels within 100 candles.
"as we're pushing higher and price starts to pull back the 20 EMA can act as an area of value the 50 EMA can act as an area of value an extreme stochastic can act as an area of value and a previous level of structure looking left less than 100 candles can act as an area of value"
Pending
An equity curve, even for a break-even trader, will not be a straight line but will exhibit fluctuations due to market inconsistencies.
"his Equity curve isn't going to be linear like a straight line this is what his Equity curve would look like even if he's a break even Trader he would have Toms when he was doing really well times when he did badly times when he kind of broke even"
Pending
Price is approaching the 20 EMA and a prior resistance level within 100 candles, indicating two areas of value.
"we come into not only the 20 EMA are red line but also coming into that previous area of resistance that is within 100 candles"
Pending
Even with a profitable strategy, the equity curve will show significant ups and downs (mountains and valleys) rather than a linear progression due to market volatility.
"we would have a starting point that was lower than the ending point for this Trader that's pretty obvious... this is what those profits would likely look like Our path to getting to that 2K or making that 100 is not going to be a straight line"
Pending
Price has met two criteria for areas of value: it's at the 20 EMA and a prior resistance level within 100 candles.
"we have price at the 20 EMA along with at a level of previous resistance within 100 candles looking left"
Pending
Failure in trading for 95% of individuals stems from lacking a profitable strategy, sound risk management, or the psychological discipline to adhere to a plan.
"the reason 95 percent of people fail is because they're lacking either a strategy that makes money over time a risk management plan that keeps them comfortable and emotionless during their trades or a knowledge of trading psychology and the ability to be disciplined to that strategy"
Pending
A bullish engulfing candlestick pattern has formed, serving as the entry signal.
"this is a bullish engulfing Bar for our entry"
Pending
The stop loss is set at 49 (27 + 22 pips ATR) below the entry candle.
"our stops are going to be one ATR below the entry candle the ATR is 22 down to the low is 27 27 plus 22 is 49"
Pending
The target for this trade is a 1.4:1 reward-to-risk ratio.
"looking for a 1.4 to 1 reward to risk ratio on these examples"
Pending
The trend is confirmed as bearish because the 20 EMA is below the 50 EMA.
"prices in what type of trend well the 20 image below the 50 EMA meaning we are in a downtrend looking for bearish trades"
Pending
Price is at the 50 EMA and the stochastic indicator is in the overbought territory (above 80), indicating two areas of value.
"we can tell that price is at the 50 EMA at the moment we can look for stochastics extremes which by the way we're already in one as we're in the overbought area of the stochastic which is above 80"
Pending
A broken level of structure within 100 candles to the left is identified as a third area of value.
"we look for a major level of structure within 100 candles if we look left we actually have a level of structure that was just broken right here"
Pending
A bearish engulfing candlestick pattern has formed, serving as the entry signal.
"here we have that entry which is a bearish engulfing bar"
Pending
The combination of trend, three areas of value, and a bearish engulfing entry is described as the 'perfect setup'.
"this is what we would call the absolutely perfect setup for this trading strategy"
Pending
Despite a seemingly perfect setup (uptrend, stochastic extreme, shooting star at 50 EMA, but in a downtrend), the trade resulted in a loss.
"we have prices pushing higher we have an extreme on our stochastics indicator we get that nice shooting star candle at our 50 EMA while prices are in a downtrend"
Pending
Trading strategies experience periods of high profitability and periods of underperformance.
"strategies tend to have times when they perform really well and make a lot of profit and they tend to have times when they perform not so well"
Pending
Successful traders can endure periods of drawdown when their strategies are not performing optimally.
"the winning Traders have the ability to make it through those periods of drawdown when strategies are performing less well"
Pending
Many traders expect a linear equity curve, but market inconsistencies mean profits will fluctuate, not follow a straight line upward.
"the problem with most Traders is this line is what they expect that Equity curve to look like when in reality the same markets are what we're trading even though we have a strategy that has an edge that's proven to be make money in the past and that's proven to give us profits those profits aren't going to come in a linear straight line"
Pending
Profitable trading involves periods of gains and losses ('mountains and valleys'), with an overall upward trend over time.
"we cannot expect our trading to just be a straight line from point A to point B it's going to be more like mountains and valleys that have a slope to the upside if we're trading a profitable strategy"
Pending
A summary of the trading strategy: trend identification (20/50 EMA), two of three areas of value, specific candlestick entries, 1x ATR stop loss, and 1.4:1 reward-to-risk ratio targets.
"for this strategy we're looking for price to be in Trend based on the 20 and the 50 EMA we are then looking for two out of three of the areas of value I have listed here after that we're gonna be looking for an entry our entries are the two Candlestick patterns I've shown you earlier in the video stops for these examples was one times the ATR indicator below and above the entry candle and targets for these examples was a 1.4 to 1 reward to risk ratio"
Pending
Having a trading strategy alone does not guarantee profitability.
"a trading strategy does not equal profitable trading"
Pending
Poor risk management is a primary reason traders struggle with the extreme ups and downs of their equity curve, leading to emotional turmoil.
"the reason Traders tend to have such a hard time when their Equity curve is doing this is because of one of three reasons they either have really bad risk management that's causing their peaks and valleys to be too extreme and causing emotional turmoil"
Pending
Lack of backtesting leads to uncertainty about a strategy's positive expectancy, causing discomfort during drawdowns.
"another reason Traders get really uncomfortable during this is because they have not back tested their trading strategy so they have no idea if it actually has a positive expectancy over time"
Pending
Emotional turmoil in trading stems from a lack of understanding of trading psychology and the discipline to adhere to a trading plan.
"another reason that emotional turmoil takes place is because of a lack of knowledge of trading psychology which is just your ability to stick to your plan"
Pending
95% of traders fail due to lacking a profitable strategy, effective risk management, or the psychological discipline to execute their plan.
"95 percent of people fail is because they're lacking either a strategy that makes money over time a risk management plan that keeps them comfortable and emotionless during their trades or a knowledge of trading psychology and the ability to be disciplined to that strategy and that risk management plan"
Pending